0

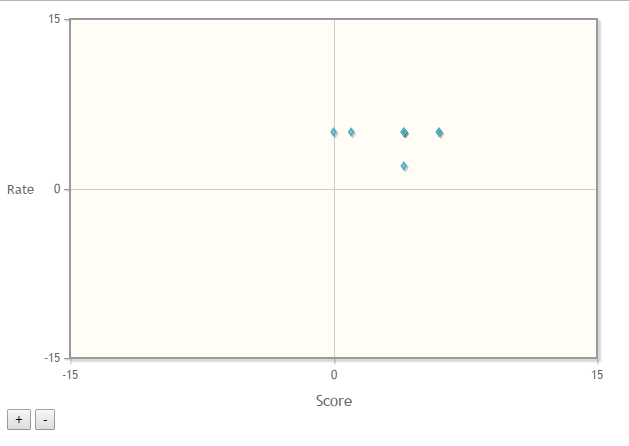
Hola estoy usando la libreria jqplotpara realizar ciertas pruebas, he creado un grafico de tipo scatter y lo he dividido en 4 cuadrantes.

Este es el codigo del script

$(document).ready(function() {                

                var qr = [
                    [1, 5, null],
                    [4, 2, null],
                    [6, 5, '2'],
                    [4, 5, '3'],
                    [0, 5, null],
                    [4, 5, '3'],
                    [6, 5, '2'],
                    [4, 5, '3']
                ];
                var max = 15;
                var min = -15;                                            
                var gr_html = null;
                gr_html = $.jqplot('linegraph', [qr], {
                    seriesDefaults: {
                        showLine: false,
                        markerRenderer: $.jqplot.MarkerRenderer,
                        markerOptions: {
                            size: 5
                        }
                    },
                    series: [{
                        pointLabels: {
                            show: false,
                        },
                        markerOptions: {
                            style: 'triangle',
                            size: 5,
                        },
                    }],
                    axes: {
                        xaxis: {
                            label: 'Score',
                            min: min,
                            max : max,
                            numberTicks: 3,
                            showGridline: false
                        },
                        yaxis: {
                            renderer: $.jqplot.canvasTextRenderer,
                            label: 'Rate',
                            labelRenderer: $.jqplot.CanvasAxisLabelRenderer,
                            labelOptions: {
                                fontSize: '10pt'
                            },
                            min: min,
                            max : max,
                            numberTicks: 3,
                            showGridline: false
                        },
                    },
                    grid: {
                        drawGridLines: true,        // wether to draw lines across the grid or not.
                        gridLineColor: '#cccccc',   // *Color of the grid lines.
                        background: '#fffdf6',      // CSS color spec for background color of grid.
                        borderColor: '#999999',     // CSS color spec for border around grid.
                        borderWidth: 2.0,           // pixel width of border around grid.
                        shadow: true,               // draw a shadow for grid.
                        shadowAngle: 45,            // angle of the shadow.  Clockwise from x axis.
                        shadowOffset: 1.5,          // offset from the line of the shadow.
                        shadowWidth: 3,             // width of the stroke for the shadow.
                        shadowDepth: 3,             // Number of strokes to make when drawing shadow.
                                                    // Each stroke offset by shadowOffset from the last.
                        shadowAlpha: 0.07,          // Opacity of the shadow
                        renderer: $.jqplot.CanvasGridRenderer,  // renderer to use to draw the grid.
                        rendererOptions: {}         // options to pass to the renderer.  Note, the default
                                                    // CanvasGridRenderer takes no additional options.
                    }
                });         


                $("#botonZoom").click(function(){
                    max = max -1;
                    min = min +1;
                    gr_html.replot({resetAxes:['xaxis'], axes:{xaxis:{max:max,min:min,numberTicks:3}}});
                    gr_html.replot({resetAxes:['yaxis'], axes:{yaxis:{max:max,min:min,numberTicks:3}}});
                    
                    <!-- gr_html.replot({resetAxes:true}) -->
                });
                $("#botonZoom2").click(function(){
                    max = max +1;
                    min = min-1;
                    gr_html.replot({resetAxes:['xaxis'], axes:{xaxis:{max:max,min:min,numberTicks:3}}});
                    gr_html.replot({resetAxes:['yaxis'], axes:{yaxis:{max:max,min:min,numberTicks:3}}});
                });
            });

El cual me deja un grafico tal que asi: Grafico 1
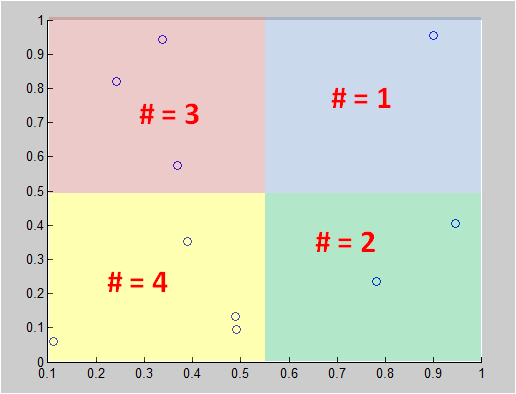
Mi intencion seria que cada cuadrante tuviera un color distinto, algo de este estilo:

Grafico 2

No hagais mucho caso a que los graficos sean distintos, es para que se comprenda como quiero pintar los cuadrantes
2 respuestas 2

1

Puedes usar un rectangle overlay como se explica en la documentacion: http://www.jqplot.com/examples/draw-rectangles.php agregando en la configuracion del objeto la seccion canvasOverlay y estableciendo los valores correctos de xmin, xmax, ymin, ymax mas el resto de configuraciones de color y formato.

canvasOverlay: {
    show: true,
    objects: [
      { rectangle: { xmin:3.5, xmax: 8.2, ymin: 10, ymax: 70, xminOffset: "0px", xmaxOffset: "0px", yminOffset: "0px", ymaxOffset: "0px",
                color: "rgba(200, 100, 100, 0.3)", showTooltip: true, tooltipFormatString: "Ideal Zone" } },
    ]
  } 
1
  • Funciona muchas gracias Commented el 13 mar. 2017 a las 14:46
0

No puedo ver tus imágenes por que en este momento la pc tiene filtros, pero si entendí bien, si es posible, te mando un link de un ejemplo y el código:

http://www.jqplot.com/examples/multipleBarColors.php

<script type="text/javascript" class="code">
$(document).ready(function(){
    // A Bar chart from a single series will have all the bar colors the same.
    var line1 = [['Nissan', 4],['Porche', 6],['Acura', 2],['Aston Martin', 5],['Rolls Royce', 6]];

    $('#chart1').jqplot([line1], {
        title:'Default Bar Chart',
        seriesDefaults:{
            renderer:$.jqplot.BarRenderer
        },
        axes:{
            xaxis:{
                renderer: $.jqplot.CategoryAxisRenderer
            }
        }
    });
});
</script>

<script type="text/javascript" class="code">
$(document).ready(function(){
    var line1 = [['Nissan', 4],['Porche', 6],['Acura', 2],['Aston Martin', 5],['Rolls Royce', 6]];

    $('#chart2').jqplot([line1], {
        title:'Bar Chart with Varying Colors',
        seriesDefaults:{
            renderer:$.jqplot.BarRenderer,
            rendererOptions: {
                // Set the varyBarColor option to true to use different colors for each bar.
                // The default series colors are used.
                varyBarColor: true
            }
        },
        axes:{
            xaxis:{
                renderer: $.jqplot.CategoryAxisRenderer
            }
        }
    });
});
</script>

<script type="text/javascript" class="code">
$(document).ready(function(){
    var line1 = [['Nissan', 4],['Porche', 6],['Acura', 2],['Aston Martin', 5],['Rolls Royce', 6]];

    $('#chart3').jqplot([line1], {
        title:'Bar Chart with Custom Colors',
        // Provide a custom seriesColors array to override the default colors.
        seriesColors:['#85802b', '#00749F', '#73C774', '#C7754C', '#17BDB8'],
        seriesDefaults:{
            renderer:$.jqplot.BarRenderer,
            rendererOptions: {
                // Set varyBarColor to tru to use the custom colors on the bars.
                varyBarColor: true
            }
        },
        axes:{
            xaxis:{
                renderer: $.jqplot.CategoryAxisRenderer
            }
        }
    });
});
</script>

Saludos

Tu Respuesta

By clicking “Publica tu respuesta”, you agree to our terms of service and acknowledge you have read our privacy policy.

¿No es la respuesta que buscas? Examina otras preguntas con la etiqueta o formula tu propia pregunta.