Mediante ajax obtengo el dato que quiero mostrar en mi gráfico de la siguiente manera:
$.ajax({
    url: '/grafico/3',
    type: 'GET',
    async: true,
    dataType: "json",
    success: function (data) {
        console.log(data);
        graficoMedia(data);
    }
});
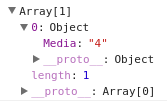
Este data me devuelve lo siguiente:
Luego, creo mi gráfico solid gauge de la siguiente manera:
function graficoMedia (array) {
$('#chart3').highcharts({
chart: {
    type: 'solidgauge'
},

title: null,

pane: {
    center: ['50%', '85%'],
    size: '140%',
    startAngle: -90,
    endAngle: 90,
    background: {
        backgroundColor: (Highcharts.theme && Highcharts.theme.background2) || '#EEE',
        innerRadius: '60%',
        outerRadius: '100%',
        shape: 'arc'
    }
},

tooltip: {
    enabled: false
},

// the value axis
yAxis: {
    stops: [
        [0.1, '#55BF3B'], // green
        [0.5, '#DDDF0D'], // yellow
        [0.9, '#DF5353'] // red
    ],
    lineWidth: 0,
    minorTickInterval: null,
    tickAmount: 2,
    title: {
        y: -70
    },
    labels: {
        y: 16
    },
    min: 0,
    max: 15,
    title: {
        text: 'Media'
    }
},

plotOptions: {
    solidgauge: {
        dataLabels: {
            y: 5,
            borderWidth: 0,
            useHTML: true
        }
    }
},
credits: {
    enabled: false
},

series: [{
    name: 'Media',
    data: array[0].Media,
    dataLabels: {
        format: '<div style="text-align:center"><span style="font-size:25px;color:' +
            ((Highcharts.theme && Highcharts.theme.contrastTextColor) || 'black') + '">{y}</span><br/>' +
               '<span style="font-size:12px;color:silver">media</span></div>'
    },
    tooltip: {
        valueSuffix: ' Media'
    }
}]
});
}
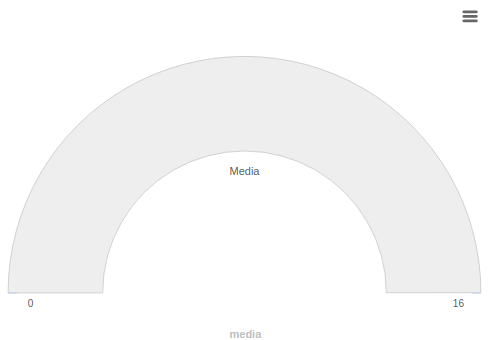
Pero este no se muestra correctamente:
Pero sin embargo si cambio mi campo data dentro de series de la siguiente forma:
series: [{
name: 'Media',
data: [4],
dataLabels: {
    format: '<div style="text-align:center"><span style="font-size:25px;color:' +
        ((Highcharts.theme && Highcharts.theme.contrastTextColor) || 'black') + '">{y}</span><br/>' +
           '<span style="font-size:12px;color:silver">media</span></div>'
},
tooltip: {
    valueSuffix: ' Media'
}
}]
Este si que funciona correctamente:
Gracias de antemano.


