Tengo el siguiente código en python:
import matplotlib.pyplot as plt
x_values = range(1, 1001)
y_values = [x ** 2 for x in x_values]
plt.style.use('seaborn-v0_8')
fig, ax = plt.subplots()
ax.scatter(x_values, y_values, s = 10)
ax.set_title("Square Numbers", fontsize = 24)
ax.set_xlabel("Value", fontsize = 10)
ax.set_ylabel("Square of value", fontsize = 10)
ax.tick_params(axis = 'both', labelsize = 10)
ax.axis([0, 1000, 0, 1000000])
plt.show()
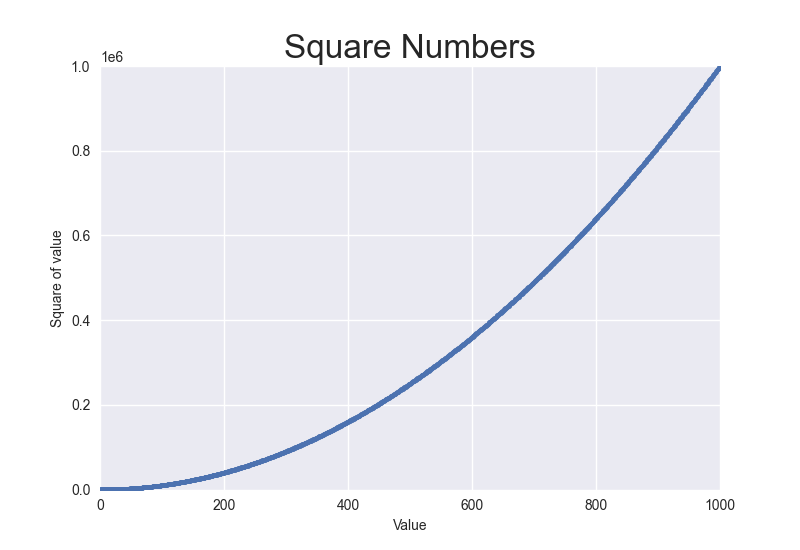
El resultado es el siguiente:
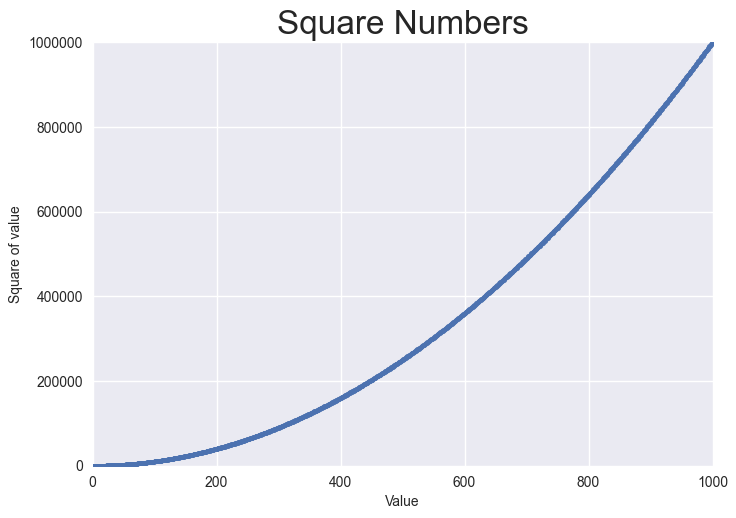
El problema es que en el eje Y siempre aparecen los valores en notación exponencial, como se ve. Como puedo hacer para que aparezcan "normales" (200000, 400000, etc)?

