Muy buenos días. Mi duda es la siguiente. A partir de este DataFrame:
                      Open   High    Low  Close   Volume  Delta
Open time
2022-06-09 10:05:00  14.09  14.18  14.08  14.13  4015.54   0.10
2022-06-09 10:10:00  14.11  14.14  14.10  14.13  2741.05   0.04
2022-06-09 10:15:00  14.11  14.11  14.09  14.10  1131.58   0.02
2022-06-09 10:20:00  14.10  14.10  14.03  14.06  1285.78   0.07
2022-06-09 10:25:00  14.05  14.08  14.03  14.07   975.16   0.05
2022-06-09 10:30:00  14.07  14.07  14.03  14.04   177.47   0.04
2022-06-09 10:35:00  14.05  14.07  14.05  14.07   542.74   0.02
2022-06-09 10:40:00  14.07  14.09  14.03  14.07   195.85   0.06
2022-06-09 10:45:00  14.07  14.07  14.01  14.01   236.19   0.06
2022-06-09 10:50:00  14.02  14.03  13.92  13.92  1555.03   0.11
2022-06-09 10:55:00  13.91  13.96  13.89  13.89  2648.26   0.07
2022-06-09 11:00:00  13.89  13.95  13.89  13.92  1603.26   0.06
2022-06-09 11:05:00  13.91  13.93  13.89  13.91   291.61   0.04
2022-06-09 11:10:00  13.90  13.93  13.90  13.93   810.92   0.03
2022-06-09 11:15:00  13.92  13.92  13.84  13.87   922.61   0.08
2022-06-09 11:20:00  13.87  13.89  13.84  13.87   711.94   0.05
2022-06-09 11:25:00  13.87  13.89  13.85  13.87   220.68   0.04
2022-06-09 11:30:00  13.87  13.88  13.84  13.85   532.34   0.04
2022-06-09 11:35:00  13.87  13.88  13.86  13.86   447.01   0.02
2022-06-09 11:40:00  13.87  13.87  13.83  13.86   327.16   0.04
2022-06-09 11:45:00  13.87  13.90  13.83  13.83   443.14   0.07
2022-06-09 11:50:00  13.82  13.82  13.77  13.77  2263.42   0.05
2022-06-09 11:55:00  13.76  13.76  13.69  13.72  5244.61   0.07
2022-06-09 12:00:00  13.72  13.76  13.71  13.76   648.31   0.05
2022-06-09 12:05:00  13.76  13.82  13.75  13.78   888.02   0.07
2022-06-09 12:10:00  13.78  13.78  13.72  13.75   422.03   0.06
2022-06-09 12:15:00  13.75  13.75  13.55  13.55  8625.01   0.20
2022-06-09 12:20:00  13.56  13.59  13.46  13.50  3072.96   0.13
2022-06-09 12:25:00  13.49  13.59  13.49  13.58  1322.05   0.10
2022-06-09 12:30:00  13.59  13.59  13.51  13.51  1728.49   0.08
2022-06-09 12:35:00  13.51  13.55  13.49  13.54  2092.12   0.06
2022-06-09 12:40:00  13.53  13.53  13.50  13.50  1296.22   0.03
2022-06-09 12:45:00  13.50  13.57  13.50  13.56  1988.30   0.07
2022-06-09 12:50:00  13.56  13.56  13.49  13.51  1326.04   0.07
2022-06-09 12:55:00  13.51  13.53  13.50  13.52  2943.91   0.03
2022-06-09 13:00:00  13.52  13.58  13.50  13.58  1083.32   0.08
2022-06-09 13:05:00  13.57  13.60  13.56  13.56   300.71   0.04
2022-06-09 13:10:00  13.57  13.66  13.56  13.64   836.82   0.10
2022-06-09 13:15:00  13.63  13.67  13.63  13.65   549.16   0.04
2022-06-09 13:20:00  13.64  13.65  13.62  13.64   330.04   0.03
2022-06-09 13:25:00  13.65  13.65  13.61  13.62   670.16   0.04
2022-06-09 13:30:00  13.62  13.68  13.57  13.68  1022.69   0.11
2022-06-09 13:35:00  13.69  13.69  13.60  13.60   822.50   0.09
2022-06-09 13:40:00  13.59  13.63  13.52  13.59  3606.68   0.11
2022-06-09 13:45:00  13.59  13.65  13.55  13.62  1766.37   0.10
2022-06-09 13:50:00  13.62  13.69  13.61  13.67   526.19   0.08
2022-06-09 13:55:00  13.65  13.70  13.64  13.70  1233.11   0.06
2022-06-09 14:00:00  13.69  13.70  13.60  13.61  3429.53   0.10
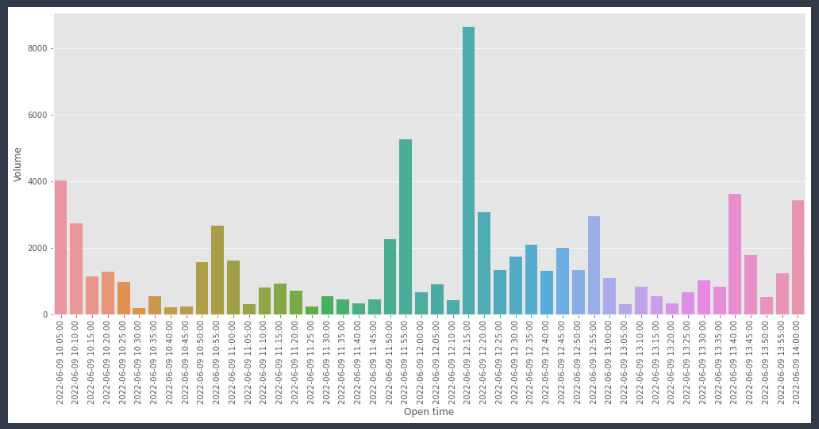
Deseo que esta gráfica ("Open time"-"Volume"):
fig,ax = plt.subplots(figsize=(17,7))
sns.barplot(ar.index, ar.Volume, ax=ax)
ax.tick_params(axis='x', labelrotation = 90)
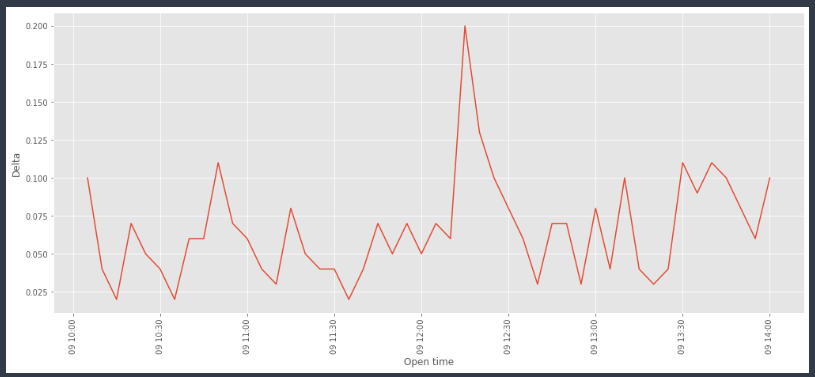
Y esta otra gráfica ("Open Time"-"Delta"):
fig,ax = plt.subplots(figsize=(17,7))
sns.lineplot(ar.index, ar.Delta, ax=ax)
ax.tick_params(axis='x', labelrotation = 90)
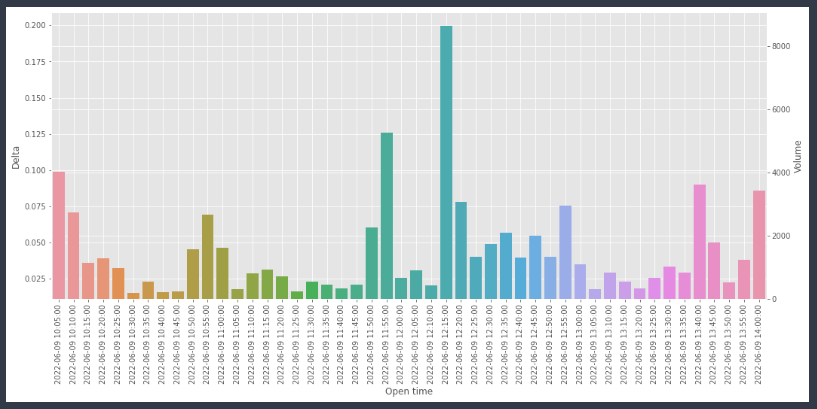
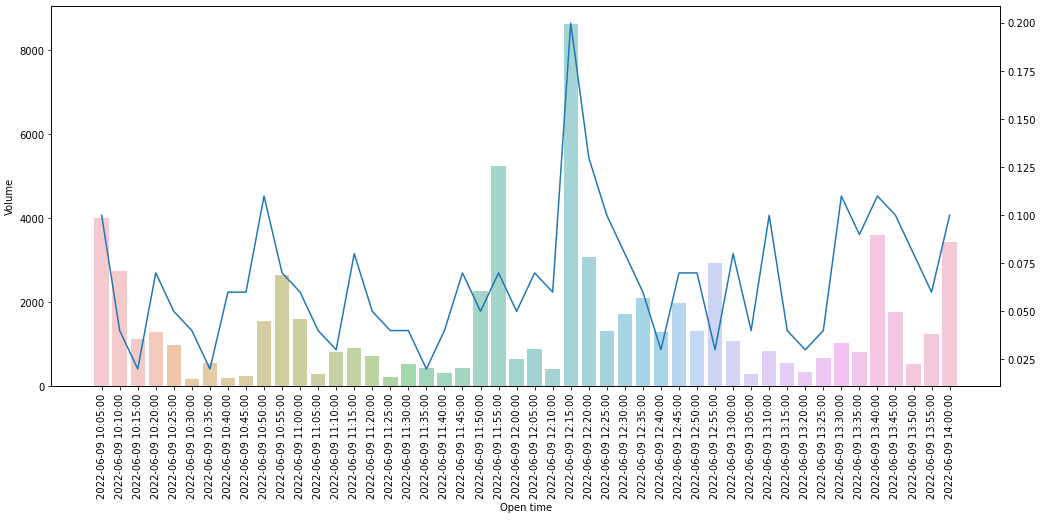
Aparezcan en una misma gráfica. Para eso probé lo siguiente:
fig,ax = plt.subplots(figsize=(17,7))
ax2 = ax.twinx()

sns.lineplot(ar.index, ar.Delta, ax=ax)
sns.barplot(ar.index, ar.Volume, ax=ax2)

ax.tick_params(axis='x', labelrotation = 90)
El eje "y" alternativo se ve bien pero la primera gráfica no aparece.
Y esa sería mi consulta. Desde ya muchas gracias y cualquier habilitación es bienvenida (a simple vista lo primero que veo es que debería hacer coincider los "ticks" digamos de cada eje "y").
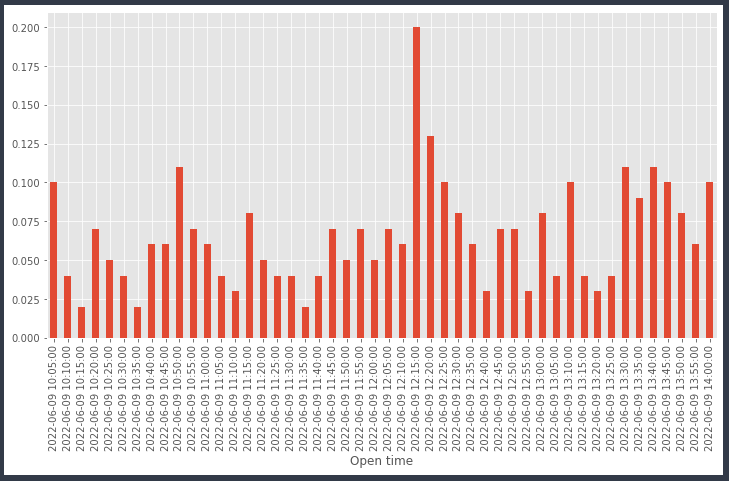
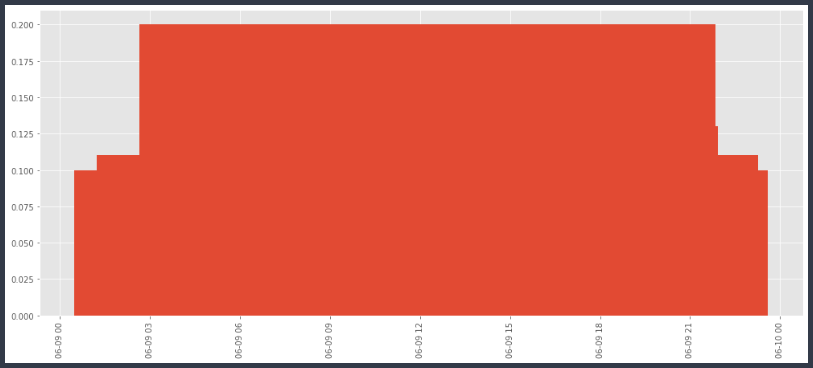
PD: Consulta paralela. Cuando trato de hacer un gráfico de barra, utilizando matplotlib, de la siguiente manera:
ar['Delta'].plot(kind='bar', figsize = (12,6))
Pero si lo hago de esta otra forma:
fig,ax = plt.subplots(figsize=(17,7))
ax.bar(ar.index, ar.Delta, width=0.8)
ax.tick_params(axis='x', labelrotation = 90)
Y ahora si que sería todo. De antemano muchas gracias y que tengan un buen día
