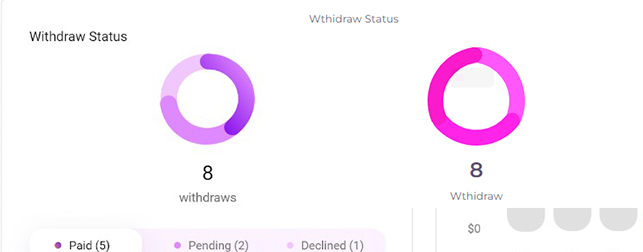
Estoy haciendo un gráfico de rosquillas con Chart.JS que se parece al diseño, lo he hecho pero no es un círculo perfecto y es muy triangular. Gracias por su ayuda.
const ctxx = document.getElementById('myChartt'); const myChartt = new Chart(ctxx, {
type: 'doughnut',
data: {
    labels: ['Mo', 'Tu', 'We'],
    datasets: [{
        label: 'Stock de productos',
        data: [6, 6, 6],
        backgroundColor: [
            'rgba(250, 107, 250)',
            'rgba(231, 73, 231)',
            'rgba(202, 65, 202)',
        ],
        borderWidth: 0,
        cutout: '80',
        borderRadius: 40,
        offset: -58

    }]
},
options: {
    maintainAspectRatio: false,
    plugins: {
        legend: {
            display: false
        },
    }
} });
