Introducción
Recientemente aprendí a graficar Medias Móviles Simples (abreviadas "SMA" por sus siglas en inglés) usando la librería de MatPlotLibFinance en Python3, las Medias Móviles Simples son líneas de tendencia que ayudan al inversionista en la determinación de buenos momentos para entrar a comprar o vender un activo.
Datos
Las siguientes variables contienen los datos empleados en el Script para graficar la acción del precio, la primera variable se nombró como df_trading_pair y contiene la siguiente información:
| Index | Start Date | Open Price | High Price | Low Price | Close Price | Volume | End Date | Abs((CP-OP)/CP)*100 | Low SMA 9 | Close SMA 25 | High SMA 99 |
|---|---|---|---|---|---|---|---|---|---|---|---|
| 0 | 2022-10-23 23:42:00 | 29.24 | 29.28 | 29.24 | 29.25 | 2145.0 | 2022-10-23 23:44:59.999 | 0.03 | 29.195555555555554 | 29.236400000000003 | 28.95191919191919 |
| 1 | 2022-10-23 23:45:00 | 29.25 | 29.27 | 29.24 | 29.24 | 2233.0 | 2022-10-23 23:47:59.999 | 0.03 | 29.192222222222224 | 29.239199999999997 | 28.95848484848485 |
| 2 | 2022-10-23 23:48:00 | 29.24 | 29.24 | 29.23 | 29.23 | 1399.0 | 2022-10-23 23:50:59.999 | 0.03 | 29.193333333333335 | 29.2316 | 28.96454545454545 |
| 3 | 2022-10-23 23:51:00 | 29.23 | 29.24 | 29.21 | 29.21 | 2603.0 | 2022-10-23 23:53:59.999 | 0.07 | 29.19888888888889 | 29.2284 | 28.97060606060606 |
| 4 | 2022-10-23 23:54:00 | 29.22 | 29.3 | 29.22 | 29.25 | 5576.0 | 2022-10-23 23:56:59.999 | 0.1 | 29.209999999999997 | 29.228 | 28.977575757575757 |
| 5 | 2022-10-23 23:57:00 | 29.24 | 29.28 | 29.23 | 29.26 | 3848.0 | 2022-10-23 23:59:59.999 | 0.07 | 29.221111111111114 | 29.226799999999997 | 28.983636363636364 |
| 6 | 2022-10-24 00:00:00 | 29.26 | 29.34 | 29.25 | 29.27 | 9973.0 | 2022-10-24 00:02:59.999 | 0.03 | 29.22666666666667 | 29.2288 | 28.990202020202016 |
| 7 | 2022-10-24 00:03:00 | 29.28 | 29.36 | 29.26 | 29.34 | 11754.0 | 2022-10-24 00:05:59.999 | 0.2 | 29.234444444444446 | 29.233600000000003 | 28.996969696969696 |
| 8 | 2022-10-24 00:06:00 | 29.34 | 29.44 | 29.33 | 29.41 | 28414.0 | 2022-10-24 00:08:59.999 | 0.24 | 29.245555555555555 | 29.24 | 29.003939393939394 |
| 9 | 2022-10-24 00:09:00 | 29.42 | 29.48 | 29.4 | 29.43 | 21753.0 | 2022-10-24 00:11:59.999 | 0.03 | 29.263333333333335 | 29.248800000000003 | 29.011414141414143 |
| 10 | 2022-10-24 00:12:00 | 29.43 | 29.43 | 29.28 | 29.28 | 9341.0 | 2022-10-24 00:14:59.999 | 0.51 | 29.26777777777778 | 29.2528 | 29.018787878787876 |
| 11 | 2022-10-24 00:15:00 | 29.29 | 29.3 | 29.25 | 29.26 | 3000.0 | 2022-10-24 00:17:59.999 | 0.1 | 29.27 | 29.2556 | 29.024040404040406 |
| 12 | 2022-10-24 00:18:00 | 29.26 | 29.29 | 29.25 | 29.28 | 3065.0 | 2022-10-24 00:20:59.999 | 0.07 | 29.27444444444445 | 29.2588 | 29.029393939393938 |
| 13 | 2022-10-24 00:21:00 | 29.27 | 29.29 | 29.26 | 29.27 | 754.0 | 2022-10-24 00:23:59.999 | 0.0 | 29.278888888888886 | 29.2612 | 29.034444444444443 |
| 14 | 2022-10-24 00:24:00 | 29.28 | 29.33 | 29.28 | 29.33 | 2657.0 | 2022-10-24 00:26:59.999 | 0.17 | 29.284444444444446 | 29.266 | 29.039292929292927 |
| 15 | 2022-10-24 00:27:00 | 29.33 | 29.39 | 29.32 | 29.33 | 3722.0 | 2022-10-24 00:29:59.999 | 0.0 | 29.29222222222222 | 29.2676 | 29.04484848484848 |
| 16 | 2022-10-24 00:30:00 | 29.34 | 29.41 | 29.34 | 29.4 | 3906.0 | 2022-10-24 00:32:59.999 | 0.2 | 29.30111111111111 | 29.2716 | 29.051010101010103 |
| 17 | 2022-10-24 00:33:00 | 29.39 | 29.39 | 29.34 | 29.34 | 3269.0 | 2022-10-24 00:35:59.999 | 0.17 | 29.302222222222227 | 29.274 | 29.056767676767677 |
| 18 | 2022-10-24 00:36:00 | 29.34 | 29.38 | 29.26 | 29.28 | 5719.0 | 2022-10-24 00:38:59.999 | 0.2 | 29.286666666666665 | 29.276 | 29.061818181818182 |
| 19 | 2022-10-24 00:39:00 | 29.28 | 29.29 | 29.23 | 29.25 | 2118.0 | 2022-10-24 00:41:59.999 | 0.1 | 29.281111111111116 | 29.2788 | 29.066060606060606 |
| 20 | 2022-10-24 00:42:00 | 29.24 | 29.24 | 29.21 | 29.23 | 1875.0 | 2022-10-24 00:44:59.999 | 0.03 | 29.276666666666667 | 29.2832 | 29.069999999999997 |
| 21 | 2022-10-24 00:45:00 | 29.23 | 29.25 | 29.21 | 29.24 | 6155.0 | 2022-10-24 00:47:59.999 | 0.03 | 29.272222222222222 | 29.284000000000002 | 29.074242424242424 |
| 22 | 2022-10-24 00:48:00 | 29.23 | 29.23 | 29.18 | 29.19 | 1913.0 | 2022-10-24 00:50:59.999 | 0.14 | 29.263333333333335 | 29.281999999999996 | 29.077777777777776 |
| 23 | 2022-10-24 00:51:00 | 29.19 | 29.2 | 29.13 | 29.14 | 6363.0 | 2022-10-24 00:53:59.999 | 0.17 | 29.246666666666663 | 29.278 | 29.081111111111113 |
| 24 | 2022-10-24 00:54:00 | 29.14 | 29.17 | 29.12 | 29.17 | 8608.0 | 2022-10-24 00:56:59.999 | 0.1 | 29.224444444444444 | 29.275199999999998 | 29.084444444444447 |
| 25 | 2022-10-24 00:57:00 | 29.17 | 29.21 | 29.17 | 29.19 | 2111.0 | 2022-10-24 00:59:59.999 | 0.07 | 29.20555555555556 | 29.272799999999997 | 29.087979797979795 |
| 26 | 2022-10-24 01:00:00 | 29.2 | 29.2 | 29.16 | 29.19 | 2259.0 | 2022-10-24 01:02:59.999 | 0.03 | 29.185555555555556 | 29.270800000000005 | 29.091313131313132 |
| 27 | 2022-10-24 01:03:00 | 29.18 | 29.21 | 29.18 | 29.21 | 1634.0 | 2022-10-24 01:05:59.999 | 0.1 | 29.176666666666662 | 29.27 | 29.094242424242424 |
| 28 | 2022-10-24 01:06:00 | 29.21 | 29.23 | 29.2 | 29.22 | 3276.0 | 2022-10-24 01:08:59.999 | 0.03 | 29.173333333333332 | 29.2704 | 29.0979797979798 |
| 29 | 2022-10-24 01:09:00 | 29.21 | 29.21 | 29.19 | 29.2 | 837.0 | 2022-10-24 01:11:59.999 | 0.03 | 29.171111111111113 | 29.2684 | 29.101717171717173 |
Por su parte, la otra variable denominada df_trading_pair_date_time_index contiene la misma información de la anterior variable con ligeras modificaciones, puesto que sólo así puede ser usada en el script de más abajo:
def set_DateTimeIndex(df_trading_pair):
    df_trading_pair = df_trading_pair.set_index('Start Date', inplace=False)
    # Rename the column names for best practices
    df_trading_pair.rename(columns = { "Open Price" : 'Open',
                                       "High Price" : 'High',
                                       "Low Price" : 'Low',
                                       "Close Price" :'Close',
                              }, inplace = True)

    return df_trading_pair
 # Create another df just to properly plot the data
 df_trading_pair_date_time_index = set_DateTimeIndex(df_trading_pair)
Script
El siguiente script en esencia buscará crear un gráfico de velas japonesas haciendo uso de la información almacenada en las variables df_trading_pair y df_trading_pair_date_time_index, sus principales detalles están explicados como comentarios dentro del script:
import pandas as pd
import mplfinance as mpf
import matplotlib.pyplot as plt
import matplotlib.dates as mdates

trading_pair = "SOLBUSD"
# Plotting
# Create my own `marketcolors` style:
mc = mpf.make_marketcolors(up='#2fc71e',down='#ed2f1a',inherit=True)
# Create my own `MatPlotFinance` style:
s  = mpf.make_mpf_style(base_mpl_style=['bmh', 'dark_background'],marketcolors=mc, y_on_right=True)

# Plot it
# First create a dictionary to store the plots to add
subplots = {'Low SMA 9': mpf.make_addplot(df_trading_pair['Low SMA 9'], width=1, color='#F0FF42'),
            'Close SMA 25': mpf.make_addplot(df_trading_pair['Close SMA 25'], width=1.5, color='#EA047E'),
            'High SMA 99': mpf.make_addplot(df_trading_pair['High SMA 99'], width=2, color='#00FFD1')}

trading_plot, axlist = mpf.plot(df_trading_pair_date_time_index,
                    figratio=(10, 6),
                    type="candle",
                    style=s,
                    tight_layout=True,
                    datetime_format = '%H:%M',
                    ylabel = "Precio ($)",
                    returnfig=True,
                    show_nontrading=True,
                    addplot=list(subplots.values())
                    )

# Add Title
symbol = trading_pair.replace("BUSD","")+"/"+"BUSD"
axlist[0].set_title(f"{symbol} - 3m", fontsize=25, style='italic', fontfamily='fantasy')

# Find which times should be shown every 6 minutes starting at the last row of the df
x_axis_minutes = []
for i in range (1,len(df_trading_pair_date_time_index),2):
    x_axis_minutes.append(df_trading_pair_date_time_index.index[-i].minute)

# Set the main "ticks" to show at the x axis
axlist[0].xaxis.set_major_locator(mdates.MinuteLocator(byminute=x_axis_minutes))

# Set the x axis label
axlist[0].set_xlabel('Zona Horaria UTC')

# Set the SMA legends
# First set the amount of legends to add to the legend box
axlist[0].legend([None]*(len(subplots)+2))
# Then Store the legend objects in a variable called "handles", based on this script, your objects to legend will appear from the third element in this list
handles = axlist[0].get_legend().legendHandles
# Finally set the corresponding names for the plotted SMA trends and place the legend box to the upper left corner of the bigger plot
axlist[0].legend(handles=handles[2:],labels=list(subplots.keys()), loc = 'upper left')
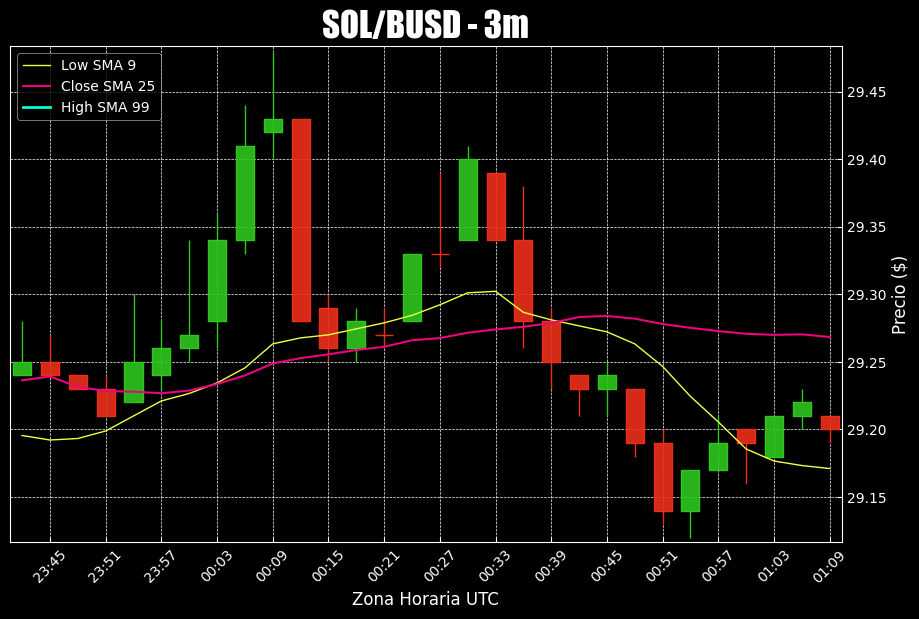
Finalmente, este script producirá la siguiente imagen:
Problema
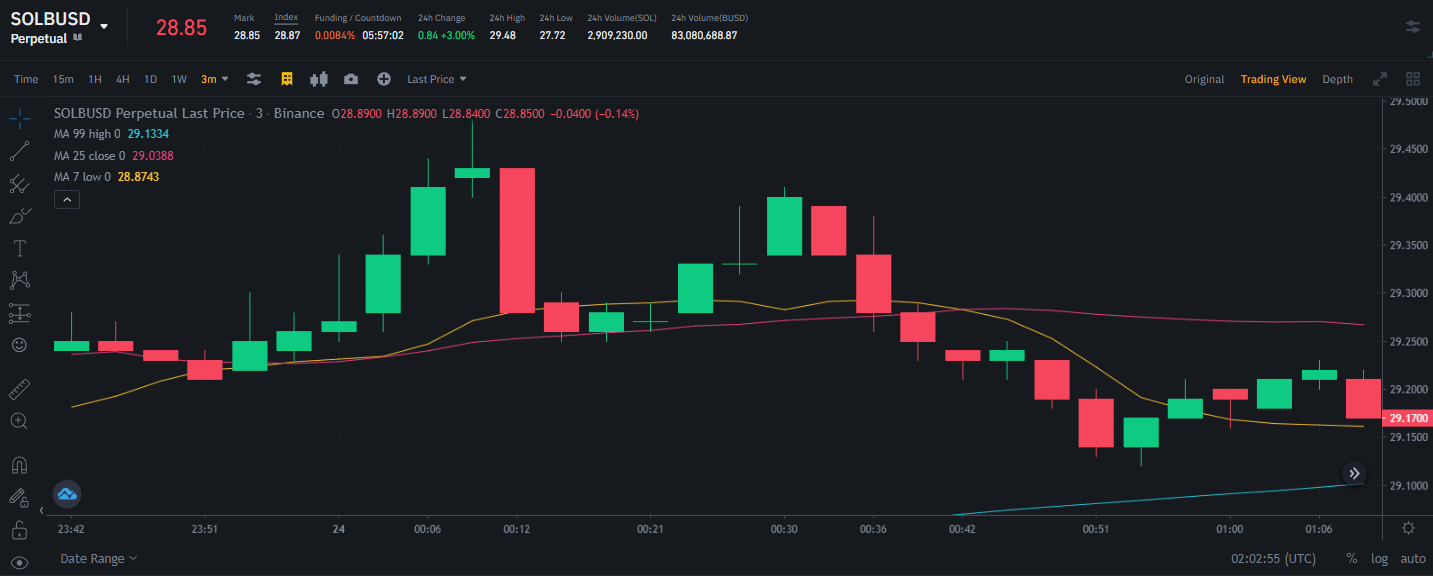
Al comparar el gráfico impreso por mi script con el gráfico mostrado por Binance:
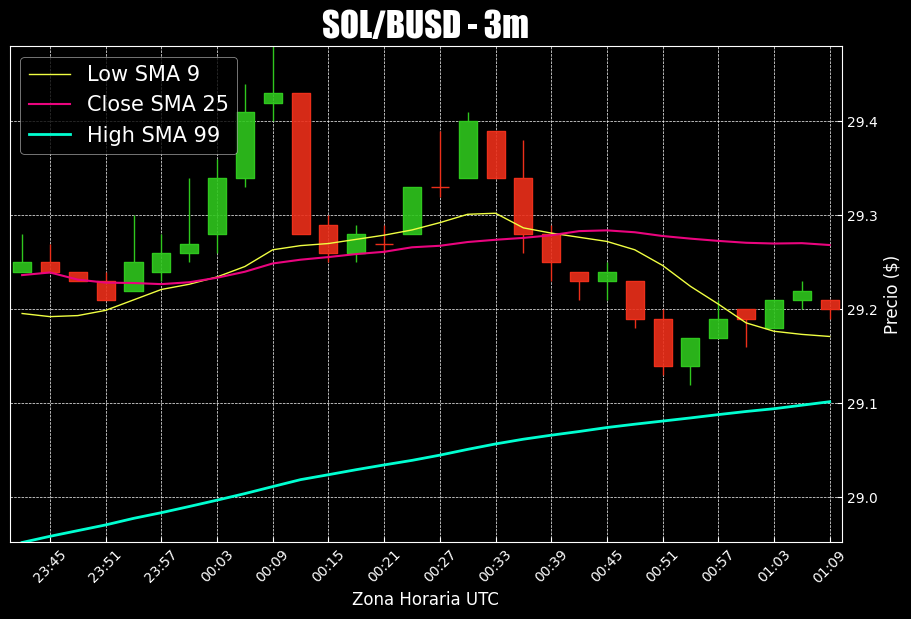
Se evidencia que la media móvil más grande (la de 99) no fue impresa como tal, o sí lo fue, creo que por el tamaño establecido (figratio=(10, 6)) para el mismo gráfico esta no aparece.
La duda
¿Cómo podría hacer una especie de alejamiento ("Zoom Out") con el script para que al imprimir el gráfico se alcanze a mostrar la media móvil de 99 sin comprometer mucho la apreciación de los demás elementos impresos en el gráfico?.


