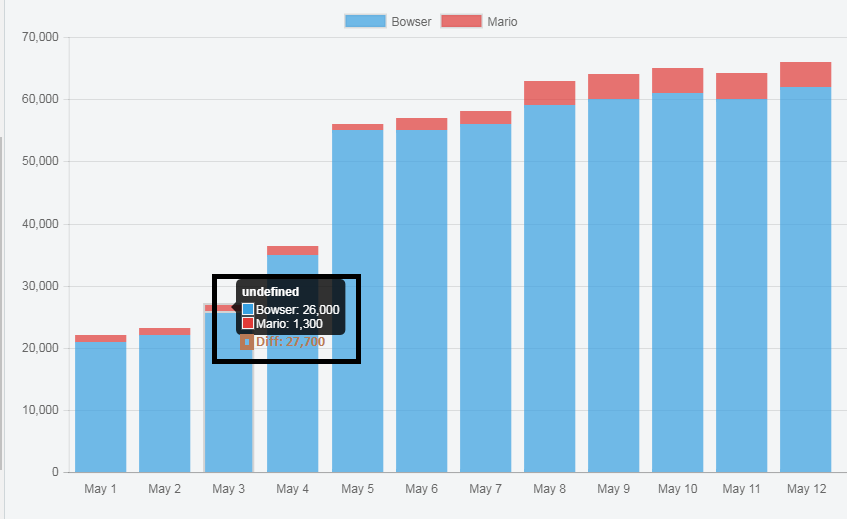
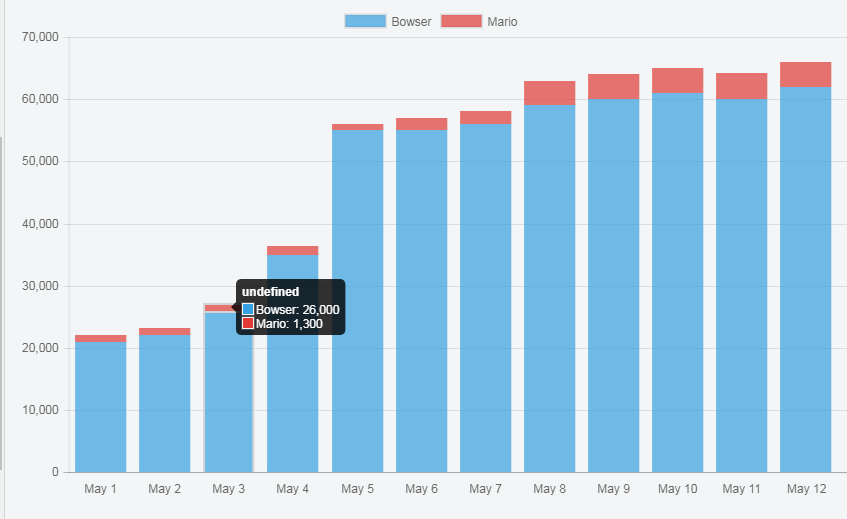
Hay alguna manera de agregar un item al tooltip y realizar calculos entre los demas?.
Por ejemplo en esta imagen se agrega un item y el valor sería la diferencia entre los otros dos valores.
Esperado:

JSFIDDLE https://fiddle.jshell.net/chanonroy/v2dm44gp/
// Return with commas in between
  var numberWithCommas = function(x) {
    return x.toString().replace(/\B(?=(\d{3})+(?!\d))/g, ",");
  };

var dataPack1 = [21000, 22000, 26000, 35000, 55000, 55000, 56000, 59000, 60000, 61000, 60100, 62000];
var dataPack2 = [1000, 1200, 1300, 1400, 1060, 2030, 2070, 4000, 4100, 4020, 4030, 4050];
var dates = ["Mon, May 1", "Tue, May 2", "Wed, May 3", "Thu, May 4", "Fri, May 5", "Sat, May 6",
  				 "Sun, May 7", "Mon, May 8", "Tue, May 9", "Wed, May 10", "Thu, May 11", "Fri, May 12"];

// Chart.defaults.global.elements.rectangle.backgroundColor = '#FF0000';

var bar_ctx = document.getElementById('bar-chart');
var bar_chart = new Chart(bar_ctx, {
  type: 'bar',
  data: {
      labels: dates,
      datasets: [
      {
          label: 'Bowser',
          data: dataPack1,
          backgroundColor: "rgba(55, 160, 225, 0.7)",
          hoverBackgroundColor: "rgba(55, 160, 225, 0.7)",
          hoverBorderWidth: 2,
          hoverBorderColor: 'lightgrey'
      },
      {
          label: 'Mario',
          data: dataPack2,
          backgroundColor: "rgba(225, 58, 55, 0.7)",
          hoverBackgroundColor: "rgba(225, 58, 55, 0.7)",
          hoverBorderWidth: 2,
          hoverBorderColor: 'lightgrey'
      },
      ]
  },
  options: {
      tooltips: {
        mode: 'label',
        callbacks: {
        title: function(tooltipItems, data) {
          return data.labels[tooltipItems.index] + ' ';
        },
        label: function(tooltipItem, data) {
          return data.datasets[tooltipItem.datasetIndex].label + ": " + numberWithCommas(tooltipItem.yLabel);
        },
       }
      },
      scales: {
        xAxes: [{
          stacked: true,
          ticks: {
            callback: function(value) { return value.substring(5, value.length); },
          },
          gridLines: { display: false },
          }],
        yAxes: [{
          stacked: true,
          ticks: {
            callback: function(value) { return numberWithCommas(value); },
          },
          }],
      }, // scales
      legend: {display: true}
  } // options
 }
);
<script src="https://cdnjs.cloudflare.com/ajax/libs/Chart.js/2.7.1/Chart.bundle.js"></script>
<canvas id="bar-chart" width="600" height="350"></canvas>