function GraphCost() {
    var $datein = document.getElementById('datein_cost');
    var $dateout = document.getElementById('dateout_cost');
    var color = "#" + Math.floor(Math.random() * 16777215).toString(16);

    var chartExist = Chart.getChart("CostScrap_sf"); // <canvas> id
    if (chartExist != undefined)
        chartExist.destroy();//si canvas existe lo destruye


    $.ajax({
        method: "GET",
        url: "../Reportes/GetScrapCost",
        contentType: "aplication/json; Charset=utf-8",
        data: { 'datein': $datein.value, 'dateout': $dateout.value },
        async: true,
        success: function (records) {
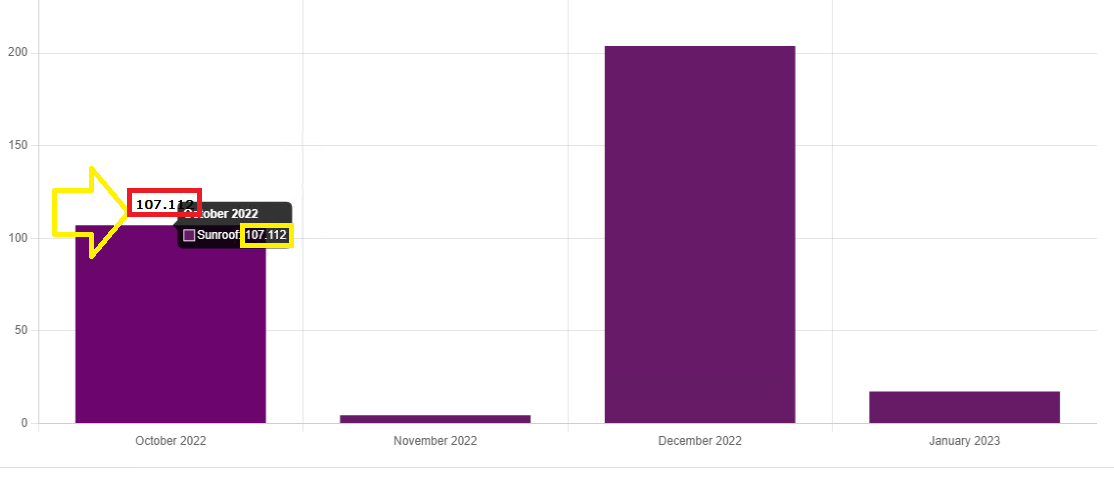
            Chart.register(ChartDataLabels);
            new Chart("CostScrap_sf", {
                type: "bar",
                data: {
                    labels: records.map(function (e) { return e.fecha }),
                    datasets: [{
                        label: 'Cost''Sunroof',
                        backgroundColor: color,
                        data: records.map(function (e) { return e.total })
                    }]
                },
                options: {
                    responsive: true,
                    plugins: {
                        title: {
                            display: true,
                            text: 'Scrap Cost from ' + $datein.value + ' to ' + $dateout.value
                        },
                        datalabels: {
                            color: 'black''white',
                            anchordisplay: 'end',function (context) {
                            align: 'top',
   return context.dataset.data[context.dataIndex] > 15;
                      display: true     },
                            font: {
                                weight: 'bold'
                            },
                        }    formatter: Math.round
                        }
                    }
                });
        }
    });
}
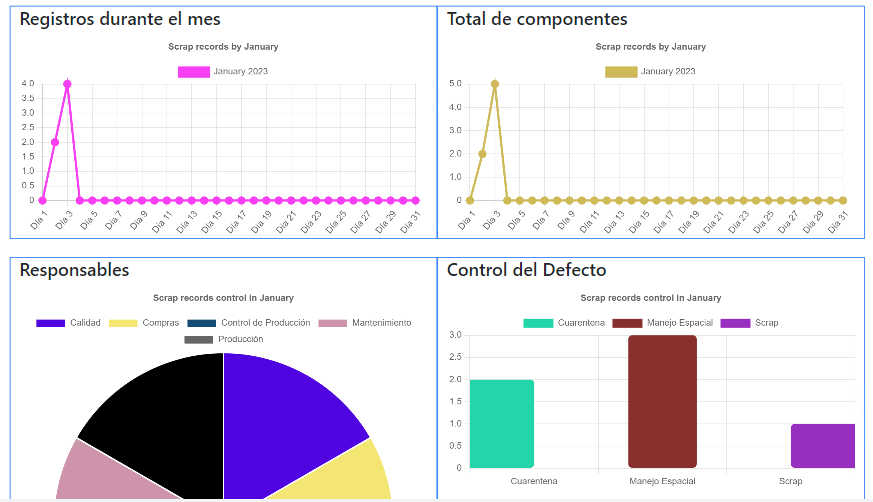
Actualmente tengo esto:

Gráficos antes de actualizar 
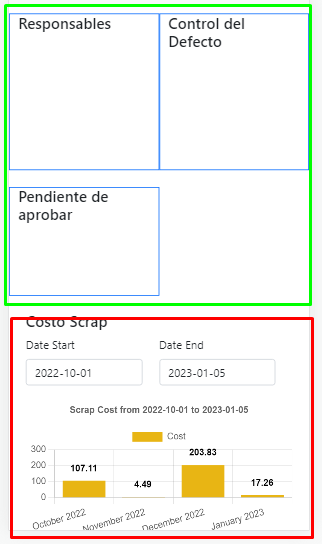
Gráficos después de actualizar


