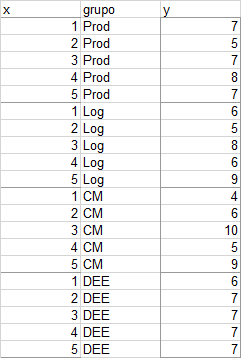
Tengo este dataframe
> datos$x <- as.factor(datos$x)
> class(datos)
[1] "data.frame"
> str(datos)
'data.frame':   55 obs. of  3 variables:
 $ x    : Factor w/ 5 levels "1","2","3","4",..: 1 2 3 4 5 1 2 3 4 5 ...
 $ grupo: Factor w/ 11 levels "CF","CM","CTO",..: 10 10 10 10 10 8 8 8 8 8 ...
 $ y    : int  7 5 7 8 7 6 5 8 6 9 ...
> barplot(datos)
Error in barplot.default(datos) : 'height' must be a vector or a matrix
Por lo que visto el barplot tiene que trabarjar en tipo table
Ahora en el ejemplo que me dieron que se trabaja con el paquete vcd es:
> data("HairEyeColor", package = "datasets")
> class(HairEyeColor)
[1] "table"
> hec <- margin.table(HairEyeColor, 2:1) #transpuso
> class(hec)
[1] "table"
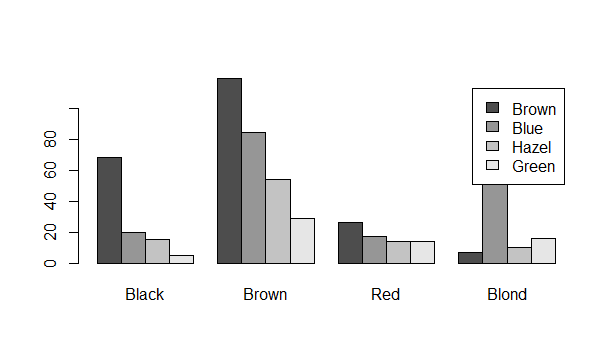
> barplot(hec, beside = TRUE, legend = TRUE)

