se agrego la etiqueta dataframe
Origen Enlace
Davitz
  • 127
  • 2
  • 9

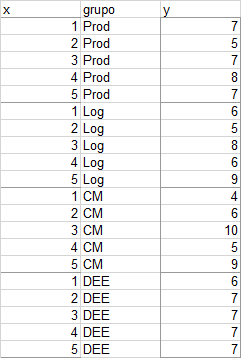
Tengo este dataframe

introducir la descripción de la imagen aquí

> datos$x <- as.factor(datos$x)
> class(datos)
[1] "data.frame"
> str(datos)
'data.frame':   55 obs. of  3 variables:
 $ x    : Factor w/ 5 levels "1","2","3","4",..: 1 2 3 4 5 1 2 3 4 5 ...
 $ grupo: Factor w/ 11 levels "CF","CM","CTO",..: 10 10 10 10 10 8 8 8 8 8 ...
 $ y    : int  7 5 7 8 7 6 5 8 6 9 ...
> barplot(datos)
Error in barplot.default(datos) : 'height' must be a vector or a matrix

Por lo que visto el barplot tiene que trabarjar en tipo tableY me produce ese error

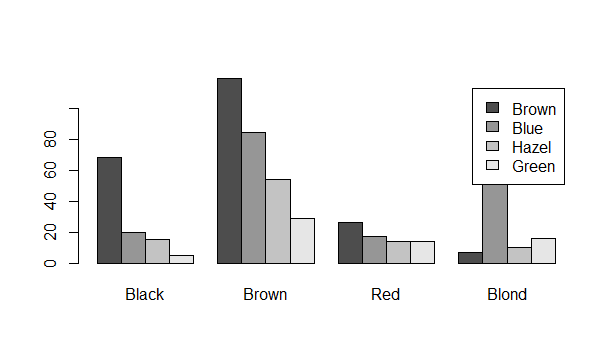
Ahora en el ejemplo que me dieron que se trabaja con el paquete vcd es:

> data("HairEyeColor", package = "datasets")
> class(HairEyeColor)
[1] "table"
> hec <- margin.table(HairEyeColor, 2:1) #transpuso 
> class(hec)
[1] "table"
> barplot(hec, beside = TRUE, legend = TRUE)
introducir la descripción de la imagen aquí

Tengo este dataframe

introducir la descripción de la imagen aquí

> datos$x <- as.factor(datos$x)
> class(datos)
[1] "data.frame"
> str(datos)
'data.frame':   55 obs. of  3 variables:
 $ x    : Factor w/ 5 levels "1","2","3","4",..: 1 2 3 4 5 1 2 3 4 5 ...
 $ grupo: Factor w/ 11 levels "CF","CM","CTO",..: 10 10 10 10 10 8 8 8 8 8 ...
 $ y    : int  7 5 7 8 7 6 5 8 6 9 ...
> barplot(datos)
Error in barplot.default(datos) : 'height' must be a vector or a matrix

Por lo que visto el barplot tiene que trabarjar en tipo table

Ahora en el ejemplo que me dieron que se trabaja con el paquete vcd es:

> data("HairEyeColor", package = "datasets")
> class(HairEyeColor)
[1] "table"
> hec <- margin.table(HairEyeColor, 2:1) #transpuso 
> class(hec)
[1] "table"
> barplot(hec, beside = TRUE, legend = TRUE)
introducir la descripción de la imagen aquí

Tengo este dataframe

introducir la descripción de la imagen aquí

> datos$x <- as.factor(datos$x)
> class(datos)
[1] "data.frame"
> str(datos)
'data.frame':   55 obs. of  3 variables:
 $ x    : Factor w/ 5 levels "1","2","3","4",..: 1 2 3 4 5 1 2 3 4 5 ...
 $ grupo: Factor w/ 11 levels "CF","CM","CTO",..: 10 10 10 10 10 8 8 8 8 8 ...
 $ y    : int  7 5 7 8 7 6 5 8 6 9 ...
> barplot(datos)
Error in barplot.default(datos) : 'height' must be a vector or a matrix

Y me produce ese error

Ahora en el ejemplo que me dieron que se trabaja con el paquete vcd es:

> data("HairEyeColor", package = "datasets")
> class(HairEyeColor)
[1] "table"
> hec <- margin.table(HairEyeColor, 2:1) #transpuso 
> class(hec)
[1] "table"
> barplot(hec, beside = TRUE, legend = TRUE)

introducir la descripción de la imagen aquí

Origen Enlace
Davitz
  • 127
  • 2
  • 9

Dataframe convertirlo a Table

Tengo este dataframe

introducir la descripción de la imagen aquí

> datos$x <- as.factor(datos$x)
> class(datos)
[1] "data.frame"
> str(datos)
'data.frame':   55 obs. of  3 variables:
 $ x    : Factor w/ 5 levels "1","2","3","4",..: 1 2 3 4 5 1 2 3 4 5 ...
 $ grupo: Factor w/ 11 levels "CF","CM","CTO",..: 10 10 10 10 10 8 8 8 8 8 ...
 $ y    : int  7 5 7 8 7 6 5 8 6 9 ...
> barplot(datos)
Error in barplot.default(datos) : 'height' must be a vector or a matrix

Por lo que visto el barplot tiene que trabarjar en tipo table

Ahora en el ejemplo que me dieron que se trabaja con el paquete vcd es:

> data("HairEyeColor", package = "datasets")
> class(HairEyeColor)
[1] "table"
> hec <- margin.table(HairEyeColor, 2:1) #transpuso 
> class(hec)
[1] "table"
> barplot(hec, beside = TRUE, legend = TRUE)

introducir la descripción de la imagen aquí