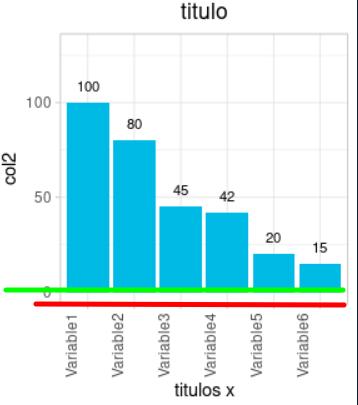
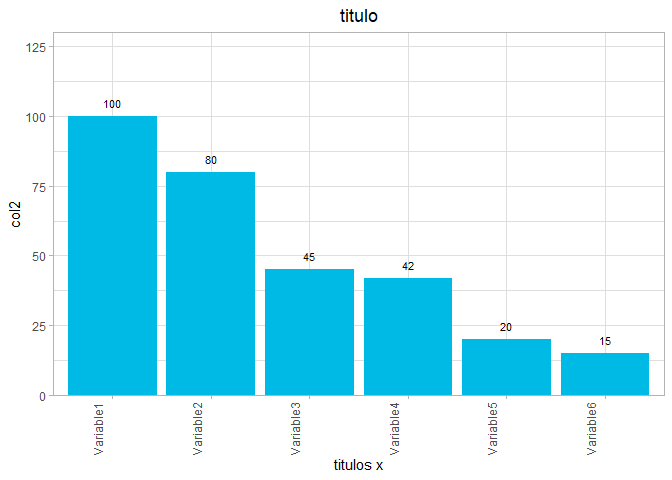
ggplot suele poner el valor 0 del eje y un poco "levantado", como si partiera del 1 (linea verde en el gráfico)
¿No se puede hacer que parta desde la linea roja?
Es decir, bajar las barras para que parezca que empieza en 0 y no en 1.
   data <- read.table(text = '

          col1                    col2
    Variable1                         100
    Variable2                         80
    Variable3                         45
    Variable4                         42
    Variable5                         20
    Variable6                         15
    ', header = TRUE, stringsAsFactors = FALSE)


ggplot(data, aes(x=col1 , y=col2)) +ylim(0,130)+
  geom_bar(stat = "identity",fill="#00bae6") +
  geom_text(stat="identity", aes(x = col1 , label = col2), vjust = -1, size=3) +
  theme_light() +
  labs(title="titulo") + theme(plot.title = element_text(hjust = 0.5)) +
  labs(x = "titulos x") +
  theme(axis.text.x = element_text(vjust = -1, angle = 90)) +
  theme(legend.position="none")

