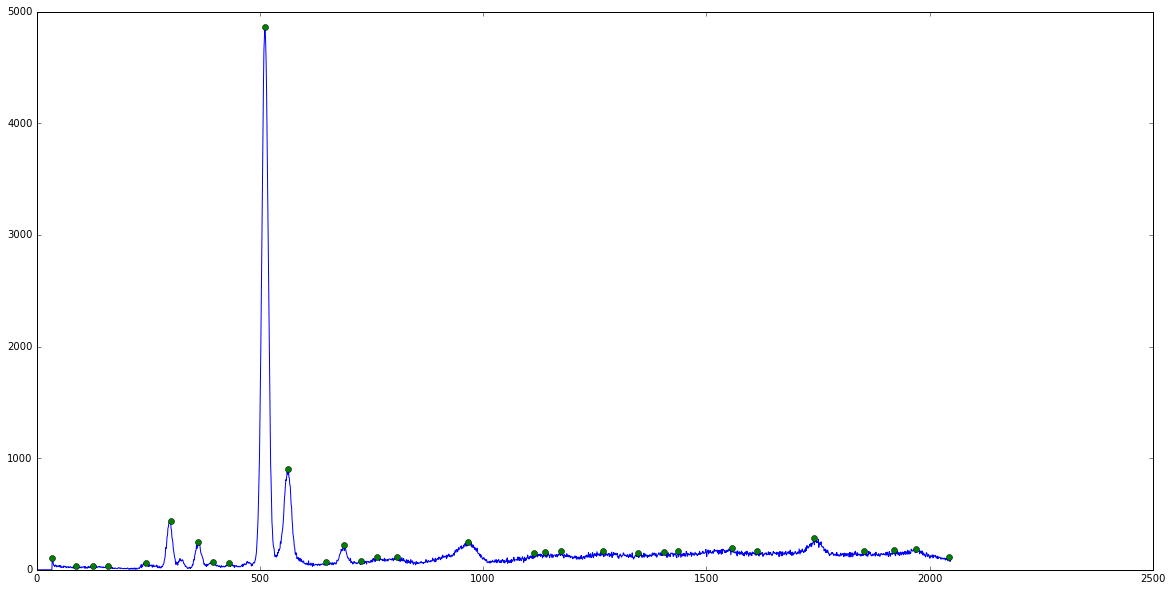
Soy nuevo en python y tengo el siguiente problema, tengo un fichero .txt que ya he logrado cargar y guardar en un arreglo. Luego he buscado los máximos en el arreglo y los he graficado, pero el criterio de búsqueda es muy pobre y me encuentra demasiados máximos, he tratado de usar
signal.find_peaks_cwt(x, np.arange())
pero no tengo idea de como implementarlo con lo que ya tengo adelantado. Aquí les va el código que he implementado:
import numpy
import numpy as np
from scipy.signal import argrelextrema
import matplotlib.pyplot as plt

#Setup and plot data
fig, ax = plt.subplots(1,2)

with open ("NC.txt", "r") as input_file:
   data = numpy.loadtxt('NC.txt')

y = np.array(data)
x = np.linspace(1, 2048, y.size)
ax[0].plot(x,y)

#get peaks
peaks_indx = argrelextrema(y, np.greater)[0]
peaks = y[peaks_indx]
ax[0].plot(x[peaks_indx],y[peaks_indx],'o')

#Get maxpeak
maxpeak = 0.
for p in peaks_indx:
    print(p)
    if y[p] > maxpeak:
        maxpeak = y[p]
        maxpeak_indx = p

#Get mask of data around maxpeak to plot
mincutoff = 0.
indx_to_plot = np.zeros(y.size, dtype=bool)
for i in range(maxpeak_indx):
    if y[maxpeak_indx-i] > mincutoff:
        indx_to_plot[maxpeak_indx-i] = True
    else:
        indx_to_plot[maxpeak_indx-i] = True
        break

for i in range(y.size-maxpeak_indx):
    if y[maxpeak_indx+i] > mincutoff:
        indx_to_plot[maxpeak_indx+i] = True
    else:
        indx_to_plot[maxpeak_indx+i] = True
        break
ax[1].plot(x[indx_to_plot],y[indx_to_plot])
plt.show()
Si alguien pudiera darme una idea de como implementar el
signal.find_peaks_cwt(x, np.arange())
y luego plotear los datos resaltando los máximos como lo hace este código.
El NC.txt es simplemente un fichero con 2048 números y esta en
Estoy usando Python34.
Por favor cualquier sugerencia seria de gran ayuda!!!!
