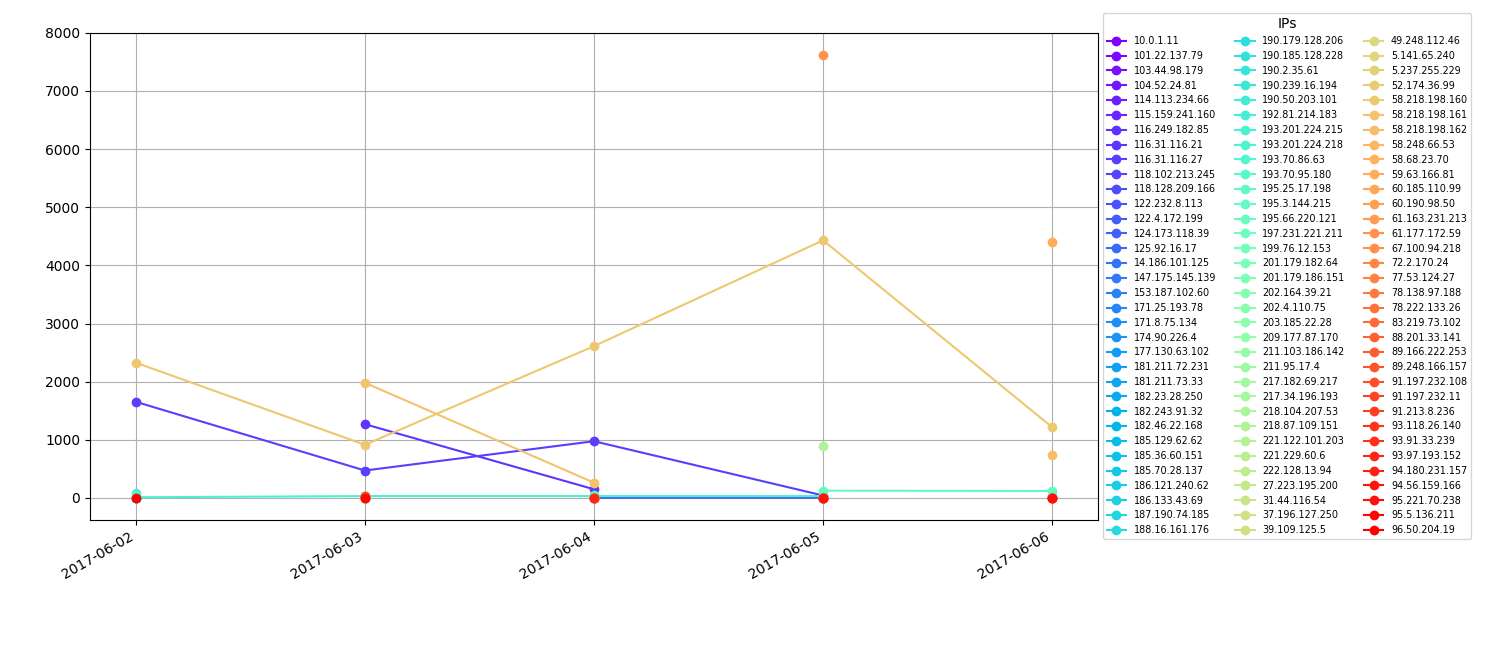
Cómo colocarían las etiquetas de este modo? Estoy intentando con annotate()...
Quiero mostrar en cada punto el valor de count (valor de y) y de ser posible el nombre de la serie del agrupador (no la fecha, sino el valor del nombre de la leyenda (en este caso la dirección IP))
Mi code:
df = pd.read_csv("DaysCountIP.csv", delimiter=',', parse_dates = ['Fecha','count'])
grupos = df.groupby(['IP'])

fig, ax = plt.subplots(figsize=(12,6))
plt.subplots_adjust(left=.06, right=None, top=.95, bottom=None)

color=iter(cm.rainbow(np.linspace(0,1,len(grupos))))

for nombre, grupo in grupos:
    ax.plot_date(x = grupo['Fecha'], y = grupo['count'], color = next(color), marker='o', ls = 'solid', label=nombre)
    ax.annotate(
    grupos,
        xy=(grupos['IP'], grupos['count']), xytext=(-20, 20))
Con esto me resultan una serie de errores varios.
[Update]
Este es el caso:
Mis Datos:
         Fecha               IP count
0   2017-06-02    116.31.116.27  1653
1   2017-06-02  147.175.145.139     3
2   2017-06-02    171.25.193.78     1
3   2017-06-02    182.46.22.168     1
4   2017-06-02    186.133.43.69     2
5   2017-06-02  193.201.224.215    11
6   2017-06-02  193.201.224.218    88
7   2017-06-02   58.218.198.160  2326
8   2017-06-02     96.50.204.19     1
9   2017-06-03  115.159.241.160     1
10  2017-06-03    116.31.116.21  1268
11  2017-06-03    116.31.116.27   471
12  2017-06-03    122.4.172.199     1
13  2017-06-03   153.187.102.60     1
14  2017-06-03     171.8.75.134     1
15  2017-06-03   187.190.74.185     2
16  2017-06-03   188.16.161.176     1
17  2017-06-03  190.179.128.206     1
18  2017-06-03   190.50.203.101     1
19  2017-06-03  193.201.224.215    31
20  2017-06-03    193.70.95.180     1
21  2017-06-03  197.231.221.211     5
22  2017-06-03   201.179.182.64     1
23  2017-06-03  221.122.101.203     1
24  2017-06-03     221.229.60.6     1
25  2017-06-03   58.218.198.160   914
26  2017-06-03   58.218.198.161  1981
27  2017-06-03     60.190.98.50     1
28  2017-06-03      72.2.170.24     1
29  2017-06-03     77.53.124.27     1
..         ...              ...   ...
85  2017-06-05     5.141.65.240     1
86  2017-06-05    5.237.255.229     1
87  2017-06-05   58.218.198.160  4431
88  2017-06-05    60.185.110.99     1
89  2017-06-05    61.177.172.59  7625
90  2017-06-05    67.100.94.218     2
91  2017-06-05   89.248.166.157     1
92  2017-06-05     93.91.33.239     2
93  2017-06-05   94.180.231.157     1
94  2017-06-05    94.56.159.166     1
95  2017-06-06   116.249.182.85     1
96  2017-06-06     125.92.16.17     1
97  2017-06-06   14.186.101.125    17
98  2017-06-06    185.36.60.151     2
99  2017-06-06   186.121.240.62     3
100 2017-06-06      190.2.35.61     2
101 2017-06-06    195.3.144.215   118
102 2017-06-06    202.164.39.21     1
103 2017-06-06      211.95.17.4     3
104 2017-06-06   217.182.69.217     2
105 2017-06-06    222.128.13.94     1
106 2017-06-06     52.174.36.99     3
107 2017-06-06   58.218.198.160  1216
108 2017-06-06   58.218.198.162   739
109 2017-06-06     59.63.166.81  4407
110 2017-06-06    78.138.97.188     1
111 2017-06-06    78.222.133.26     1
112 2017-06-06     91.213.8.236     1
113 2017-06-06    93.118.26.140     1
114 2017-06-06    95.221.70.238     1
Mi plot original sin los label:
mi código original:
import numpy as np
import pandas as pd
import matplotlib.pyplot as plt
from matplotlib import cm
from  matplotlib.dates import DateFormatter, DayLocator, AutoDateLocator, AutoDateFormatter

df = pd.read_csv("DaysCountIP.csv", delimiter=',', parse_dates = ['Fecha','count'])
grupos = df.groupby(['IP'])

print df

fig, ax = plt.subplots(figsize=(15,6.5))
plt.subplots_adjust(left=.06, right=None, top=.95, bottom=None)

color=iter(cm.rainbow(np.linspace(0,1,len(grupos))))

for nombre, grupo in grupos:
    ax.plot_date(x = grupo['Fecha'], y = grupo['count'], color = next(color), marker='o', ls = 'solid', label=nombre)
    # ax.annotate(            <<--- Aquí esta annontate erróneo
        # grupos,
        # xy=(grupos['IP'], grupos['count']), xytext=(-20, 20))

locator = DayLocator()
formatter = AutoDateFormatter(locator)
ax.xaxis.set_major_locator(locator)
ax.xaxis.set_major_formatter(formatter)
ax.autoscale_view()
ax.grid(True)
fig.autofmt_xdate()
ax.margins(0.05)

box = ax.get_position()
ax.set_position([box.x0, box.y0, box.width * 0.8, box.height])
ax.legend(ncol=3, fontsize='x-small',loc='center left', title='IPs',  bbox_to_anchor=(1, 0.5))

plt.show()
