Estoy intentando hacer un gráfico interactivo usando la funcion ggplotly. El resultado no es lo que espero porque no se muestra el mismo grafico.
Mi data es:
 La modifico en 3 columnas (X1, X2, value) para que sea apropiada para ser graficada con ggplot usando el codigo:
reshapeddata = melt(heatmapdata)
El codigo para plotear es:
heatmap1 = ggplot(reshapeddata, aes(X1, X2))+
  geom_tile(aes(fill=value),
            color = "white",
            lwd = 1,
            linetype = 1) +
  scale_fill_gradientn(limits=c(0, 600),
                       colors = c("red","yellow","white")) +
  scale_x_discrete(expand = c(0, 0)) + scale_y_continuous(expand = c(0,0), breaks=c(0,1,2,3,4,5,6,7,8,9,10,11,12))+
  labs(title=paste(" \n \n Heatmap Events \n\n"), y = "", x = "")+
  theme(plot.title = element_text(hjust = 0.5, face = "italic")) +
  geom_text(aes(label = round(value, 1)))+
  coord_flip()+
  ggnewscale::new_scale_fill() +
  geom_tile(data = filter(reshapedPDCs, value > 600),
            mapping = aes(fill = value > 600))+
  scale_fill_manual(values = "white") +
  geom_text(aes(label = round(value, 1)))
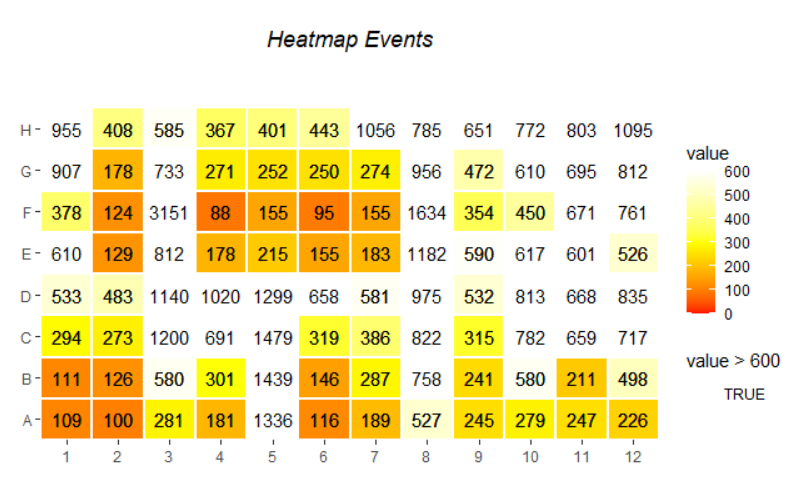
Y cuando ploteo heatmap1 obtengo el gráfico que quiero:

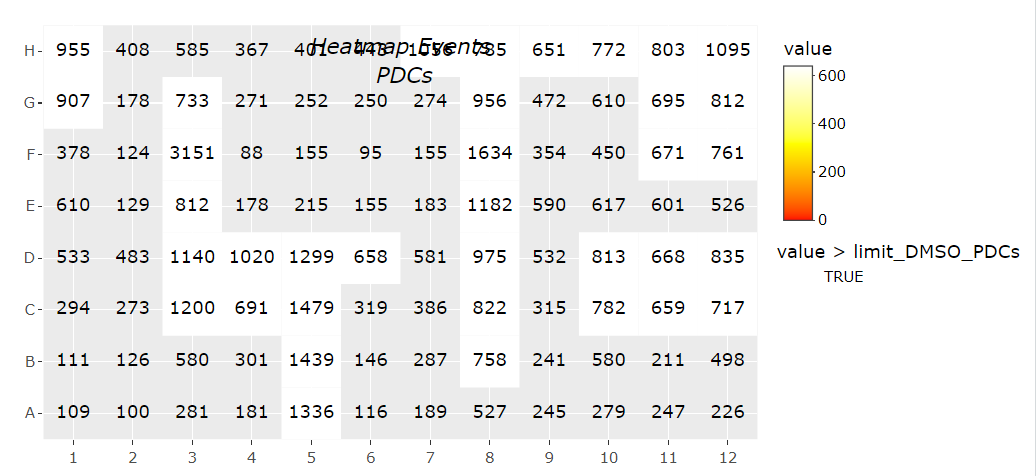
El problema está cuando intento convertirlo a gráfico interactivo usando ggplotly con: heatmap2 = ggplotly(heatmap1) . Obtengo un gráfico muy erroneo:
Warning messages:
1: In geom2trace.default(dots[[1L]][[1L]], dots[[2L]][[1L]], dots[[3L]][[1L]]) :
  geom_NewGeomTile() has yet to be implemented in plotly.
  If you'd like to see this geom implemented,
  Please open an issue with your example code at
  https://github.com/ropensci/plotly/issues
2: In geom2trace.default(dots[[1L]][[1L]], dots[[2L]][[1L]], dots[[3L]][[1L]]) :
  geom_NewGeomText() has yet to be implemented in plotly.
  If you'd like to see this geom implemented,
  Please open an issue with your example code at
  https://github.com/ropensci/plotly/issues
Como puedo hacer para que el segundo gráfico heatmap2 se parezca al primero heatmap1?

packageVersion("plotly")