Estoy leyendo un csv y graficando en Python usando el siguiente codigo:
import pandas as pd
from matplotlib import pyplot as plt
data = pd.read_csv('Direccion del archivo Csv', header = 0, sep=';')
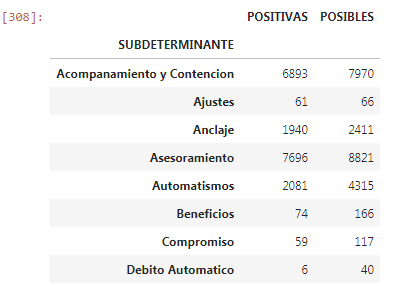
g = data.groupby(["SUBDETERMINANTE"])["POSITIVAS", "POSIBLES"].sum()
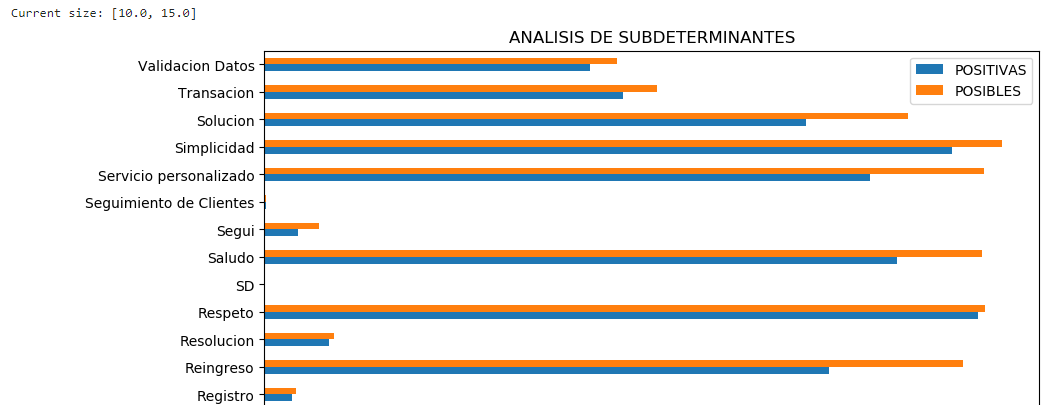
1) ¿Como ordenar g groupby de mayor a menor en base al campo positivas para que al hacer el grafico esten en ese orden?
g.plot(kind='barh', legend='Reverse')
plt.title(u'ANALISIS DE SUBDETERMINANTES', size = 12.0)
plt.xlabel(u'Suma', size = 12.0)
plt.ylabel('SubDeterminantes', size = 12.0)
fig_size = plt.rcParams["figure.figsize"]
print ("Current size:", fig_size)
fig_size[0] = 10.0
fig_size[1] = 15.0
plt.savefig('detalle')
Mostrar la grafica con los datos de mayor a menor segun el total de positivas:
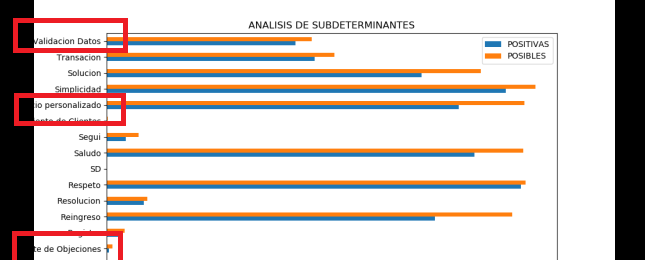
2) Al finalizar el grafico lo descargo en PNG, como puedo hacer para que se muestre el nombre entero?
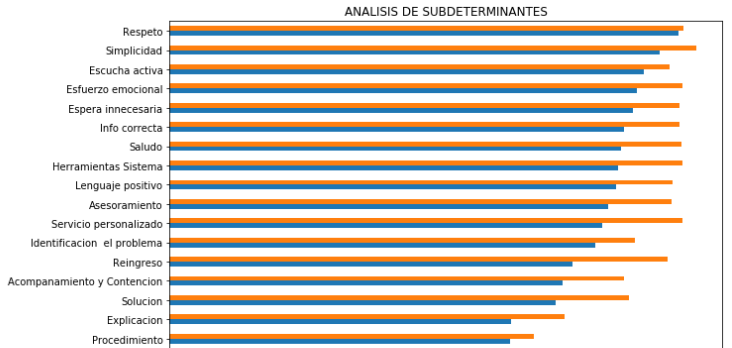
SOLUCIONADO GRACIAS A LA RESPUESTA DE ABULAFIA
import pandas as pd
from matplotlib import pyplot as plt
data = pd.read_csv('Direccion donde esta el archivo csv', header = 0, sep=';')
g = data.groupby(["SUBDETERMINANTE"])["POSITIVAS",
"POSIBLES"].sum().sort_values(by="POSITIVAS")
g.plot(kind='barh', legend='Reverse')
plt.title(u'ANALISIS DE SUBDETERMINANTES', size = 12.0)
plt.xlabel(u'Suma', size = 12.0)
plt.ylabel('SubDeterminantes', size = 12.0)
fig_size = plt.rcParams["figure.figsize"]
print ("Current size:", fig_size)
fig_size[0] = 10.0
fig_size[1] = 15.0
plt.savefig('detalle', bbox_inches='tight')


