se añadieron 661 caracteres en el cuerpo
Origen Enlace
Alexa
  • 21
  • 2
import matplotlib.pyplot as plt
import json
import time
import geopandas as gpd
from descartes import PolygonPatch
from shapely.geometry import LineString

borough = gpd.read_file('London_Borough_Excluding_MHW.shp')
borough = borough.to_crs({'init': 'epsg:4326'})

fig = plt.figure(figsize=(20, 8)) 
ax = borough.plot()

x, y = max(df2['lon'].values, df2['lat'].values)
ax.scatter(x,y, marker="*", color='b'color='r', alpha=0.7, zorder=5, s=9)
plt.show

df2 es mi dataframe que contiene las coordenadas de latitud y longitud de ciertos puntos de Londres.

$type   additionalProperties    children    childrenUrls    commonName  id  lat lon placeType   url
0   Tfl.Api.Presentation.Entities.Place, Tfl.Api.P...   [{'$type': 'Tfl.Api.Presentation.Entities.Addi...   []  []  River Street , Clerkenwell  BikePoints_1    51.529163   -0.109970   BikePoint   /Place/BikePoints_1
1   Tfl.Api.Presentation.Entities.Place, Tfl.Api.P...   [{'$type': 'Tfl.Api.Presentation.Entities.Addi...   []  []  Phillimore Gardens, Kensington  BikePoints_2    51.499606   -0.197574   BikePoint   /Place/BikePoints_2
2   Tfl.Api.Presentation.Entities.Place, Tfl.Api.P...   [{'$type': 'Tfl.Api.Presentation.Entities.Addi...   []  []  Christopher Street, Liverpool Street    BikePoints_3    51.521283   -0.084605   BikePoint   /Place/BikePoints_

Además mi shapefile tiene la siguiente estructura:

Mi problema es que obtengo la siguiente gráfica queen donde no está superpuesta:aparecen los puntos del df2, ¿como puedo corregir el código para visualizarlos? ¿Cómo hacer la figura más grande?

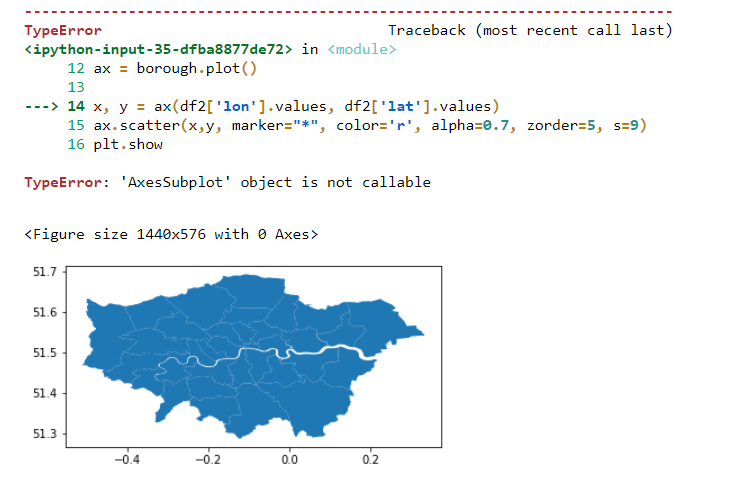
Imagen incorrecta ¿Cómo podría resolverlo?Imagen incorrecta

import matplotlib.pyplot as plt
import json
import time
import geopandas as gpd
from descartes import PolygonPatch
from shapely.geometry import LineString

borough = gpd.read_file('London_Borough_Excluding_MHW.shp')

fig = plt.figure(figsize=(20, 8)) 
ax = borough.plot()

x, y = m(df2['lon'].values, df2['lat'].values)
ax.scatter(x,y, marker="*", color='b', alpha=0.7, zorder=5, s=9)
plt.show

df2 es mi dataframe que contiene las coordenadas de latitud y longitud de ciertos puntos de Londres. Además mi shapefile tiene la siguiente estructura:

Mi problema es que obtengo la siguiente gráfica que no está superpuesta:

Imagen incorrecta ¿Cómo podría resolverlo?

borough = gpd.read_file('London_Borough_Excluding_MHW.shp')
borough = borough.to_crs({'init': 'epsg:4326'})

fig = plt.figure(figsize=(20, 8)) 
ax = borough.plot()

x, y = ax(df2['lon'].values, df2['lat'].values)
ax.scatter(x,y, marker="*", color='r', alpha=0.7, zorder=5, s=9)
plt.show

df2 es mi dataframe que contiene las coordenadas de latitud y longitud de ciertos puntos de Londres.

$type   additionalProperties    children    childrenUrls    commonName  id  lat lon placeType   url
0   Tfl.Api.Presentation.Entities.Place, Tfl.Api.P...   [{'$type': 'Tfl.Api.Presentation.Entities.Addi...   []  []  River Street , Clerkenwell  BikePoints_1    51.529163   -0.109970   BikePoint   /Place/BikePoints_1
1   Tfl.Api.Presentation.Entities.Place, Tfl.Api.P...   [{'$type': 'Tfl.Api.Presentation.Entities.Addi...   []  []  Phillimore Gardens, Kensington  BikePoints_2    51.499606   -0.197574   BikePoint   /Place/BikePoints_2
2   Tfl.Api.Presentation.Entities.Place, Tfl.Api.P...   [{'$type': 'Tfl.Api.Presentation.Entities.Addi...   []  []  Christopher Street, Liverpool Street    BikePoints_3    51.521283   -0.084605   BikePoint   /Place/BikePoints_

Además mi shapefile tiene la siguiente estructura:

Mi problema es que obtengo la siguiente gráfica en donde no aparecen los puntos del df2, ¿como puedo corregir el código para visualizarlos? ¿Cómo hacer la figura más grande?

Imagen incorrecta

se eliminaron 376 caracteres en el cuerpo
Origen Enlace
Alexa
  • 21
  • 2

Necesito representar la ubicación de varios puntos de latitud y longitud sobre el mapa de Londres. Tengo el siguiente código:

figimport =matplotlib.pyplot as plt.figure(figsize=(12,
import 8))json
import time
mimport =geopandas Basemap(width=1000000,height=955000,resolution='h',projection='lcc',lon_0=-0.1,lat_0=51.49)as gpd
m.drawcoastlines(linewidth=0.5)from descartes import PolygonPatch
mfrom shapely.fillcontinents(color='tan',lake_color='lightblue')geometry import LineString
m.drawparallels(np
borough = gpd.arangeread_file(-90.,91.,15'London_Borough_Excluding_MHW.),labels=[True,True,False,False],dashes=[2,2]shp')
m
fig = plt.drawmeridiansfigure(np.arangefigsize=(-180.,181.20,15. 8),labels=[False,False,False,True],dashes=[2,2]) 
max = borough.drawmapboundaryplot(fill_color='lightblue')

x, y = m(df2['lon'].values, df2['lat'].values)
max.scatter(x,y, marker="*", color='b', alpha=0.7, zorder=5, s=9)
m.readshapefile('London_Borough_Excluding_MHW','London')
plt.show()

df2 es mi dataframe que contiene las coordenadas de latitud y longitud de ciertos puntos de Londres. Además mi shapefile tiene la siguiente estructura:

NAME    GSS_CODE    HECTARES    NONLD_AREA  ONS_INNER   SUB_2009    SUB_2006    geometry
0   Kingston upon Thames    E09000021   3726.117    0.000   F   None    None    POLYGON ((516401.6 160201.8, 516407.3 160210.5...
1   Croydon E09000008   8649.441    0.000   F   None    None    POLYGON ((535009.2 159504.7, 535005.5 159502, ...
2   Bromley E09000006   15013.487   0.000   F   None    None    POLYGON ((540373.6 157530.4, 540361.2 157551.9...

Mi problema es que obtengo ella siguiente error:

ValueErrorgráfica que no está superpuesta: shapefile must have lat/lon vertices - it looks like this one has vertices in map projection coordinates. You can convert the shapefile to geographic coordinates using the shpproj utility from the shapelib tools (http://shapelib.maptools.org/shapelib-tools.html)

¿CómoImagen incorrecta ¿Cómo podría resolverlo?

Muchas gracias.

Necesito representar la ubicación de varios puntos de latitud y longitud sobre el mapa de Londres. Tengo el siguiente código:

fig = plt.figure(figsize=(12, 8)) 
m = Basemap(width=1000000,height=955000,resolution='h',projection='lcc',lon_0=-0.1,lat_0=51.49)
m.drawcoastlines(linewidth=0.5)
m.fillcontinents(color='tan',lake_color='lightblue')
m.drawparallels(np.arange(-90.,91.,15.),labels=[True,True,False,False],dashes=[2,2])
m.drawmeridians(np.arange(-180.,181.,15.),labels=[False,False,False,True],dashes=[2,2])
m.drawmapboundary(fill_color='lightblue')

x, y = m(df2['lon'].values, df2['lat'].values)
m.scatter(x,y, marker="*", color='b', alpha=0.7, zorder=5, s=9)
m.readshapefile('London_Borough_Excluding_MHW','London')
plt.show()

df2 es mi dataframe que contiene las coordenadas de latitud y longitud de ciertos puntos de Londres. Además mi shapefile tiene la siguiente estructura:

NAME    GSS_CODE    HECTARES    NONLD_AREA  ONS_INNER   SUB_2009    SUB_2006    geometry
0   Kingston upon Thames    E09000021   3726.117    0.000   F   None    None    POLYGON ((516401.6 160201.8, 516407.3 160210.5...
1   Croydon E09000008   8649.441    0.000   F   None    None    POLYGON ((535009.2 159504.7, 535005.5 159502, ...
2   Bromley E09000006   15013.487   0.000   F   None    None    POLYGON ((540373.6 157530.4, 540361.2 157551.9...

Mi problema es que obtengo el siguiente error:

ValueError: shapefile must have lat/lon vertices - it looks like this one has vertices in map projection coordinates. You can convert the shapefile to geographic coordinates using the shpproj utility from the shapelib tools (http://shapelib.maptools.org/shapelib-tools.html)

¿Cómo podría resolverlo?

Muchas gracias.

Necesito representar la ubicación de varios puntos de latitud y longitud sobre el mapa de Londres. Tengo el siguiente código:

import matplotlib.pyplot as plt
import json
import time
import geopandas as gpd
from descartes import PolygonPatch
from shapely.geometry import LineString

borough = gpd.read_file('London_Borough_Excluding_MHW.shp')

fig = plt.figure(figsize=(20, 8)) 
ax = borough.plot()

x, y = m(df2['lon'].values, df2['lat'].values)
ax.scatter(x,y, marker="*", color='b', alpha=0.7, zorder=5, s=9)
plt.show

df2 es mi dataframe que contiene las coordenadas de latitud y longitud de ciertos puntos de Londres. Además mi shapefile tiene la siguiente estructura:

NAME    GSS_CODE    HECTARES    NONLD_AREA  ONS_INNER   SUB_2009    SUB_2006    geometry
0   Kingston upon Thames    E09000021   3726.117    0.000   F   None    None    POLYGON ((516401.6 160201.8, 516407.3 160210.5...
1   Croydon E09000008   8649.441    0.000   F   None    None    POLYGON ((535009.2 159504.7, 535005.5 159502, ...
2   Bromley E09000006   15013.487   0.000   F   None    None    POLYGON ((540373.6 157530.4, 540361.2 157551.9...

Mi problema es que obtengo la siguiente gráfica que no está superpuesta:

Imagen incorrecta ¿Cómo podría resolverlo?

Muchas gracias.

Origen Enlace
Alexa
  • 21
  • 2

¿Cómo realizar un scatterplot sobre un shapefile en Python?

Necesito representar la ubicación de varios puntos de latitud y longitud sobre el mapa de Londres. Tengo el siguiente código:

fig = plt.figure(figsize=(12, 8)) 
m = Basemap(width=1000000,height=955000,resolution='h',projection='lcc',lon_0=-0.1,lat_0=51.49)
m.drawcoastlines(linewidth=0.5)
m.fillcontinents(color='tan',lake_color='lightblue')
m.drawparallels(np.arange(-90.,91.,15.),labels=[True,True,False,False],dashes=[2,2])
m.drawmeridians(np.arange(-180.,181.,15.),labels=[False,False,False,True],dashes=[2,2])
m.drawmapboundary(fill_color='lightblue')

x, y = m(df2['lon'].values, df2['lat'].values)
m.scatter(x,y, marker="*", color='b', alpha=0.7, zorder=5, s=9)
m.readshapefile('London_Borough_Excluding_MHW','London')
plt.show()

df2 es mi dataframe que contiene las coordenadas de latitud y longitud de ciertos puntos de Londres. Además mi shapefile tiene la siguiente estructura:

NAME    GSS_CODE    HECTARES    NONLD_AREA  ONS_INNER   SUB_2009    SUB_2006    geometry
0   Kingston upon Thames    E09000021   3726.117    0.000   F   None    None    POLYGON ((516401.6 160201.8, 516407.3 160210.5...
1   Croydon E09000008   8649.441    0.000   F   None    None    POLYGON ((535009.2 159504.7, 535005.5 159502, ...
2   Bromley E09000006   15013.487   0.000   F   None    None    POLYGON ((540373.6 157530.4, 540361.2 157551.9...

Mi problema es que obtengo el siguiente error:

ValueError: shapefile must have lat/lon vertices - it looks like this one has vertices in map projection coordinates. You can convert the shapefile to geographic coordinates using the shpproj utility from the shapelib tools (http://shapelib.maptools.org/shapelib-tools.html)

¿Cómo podría resolverlo?

Muchas gracias.