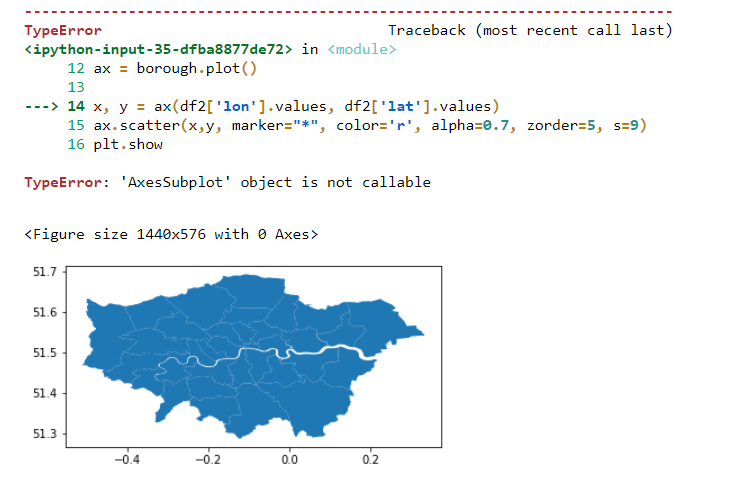
Necesito representar la ubicación de varios puntos de latitud y longitud sobre el mapa de Londres. Tengo el siguiente código:
borough = gpd.read_file('London_Borough_Excluding_MHW.shp')
borough = borough.to_crs({'init': 'epsg:4326'})

fig = plt.figure(figsize=(20, 8))
ax = borough.plot()

x, y = ax(df2['lon'].values, df2['lat'].values)
ax.scatter(x,y, marker="*", color='r', alpha=0.7, zorder=5, s=9)
plt.show
df2 es mi dataframe que contiene las coordenadas de latitud y longitud de ciertos puntos de Londres.
$type   additionalProperties    children    childrenUrls    commonName  id  lat lon placeType   url
0   Tfl.Api.Presentation.Entities.Place, Tfl.Api.P...   [{'$type': 'Tfl.Api.Presentation.Entities.Addi...   []  []  River Street , Clerkenwell  BikePoints_1    51.529163   -0.109970   BikePoint   /Place/BikePoints_1
1   Tfl.Api.Presentation.Entities.Place, Tfl.Api.P...   [{'$type': 'Tfl.Api.Presentation.Entities.Addi...   []  []  Phillimore Gardens, Kensington  BikePoints_2    51.499606   -0.197574   BikePoint   /Place/BikePoints_2
2   Tfl.Api.Presentation.Entities.Place, Tfl.Api.P...   [{'$type': 'Tfl.Api.Presentation.Entities.Addi...   []  []  Christopher Street, Liverpool Street    BikePoints_3    51.521283   -0.084605   BikePoint   /Place/BikePoints_
Además mi shapefile tiene la siguiente estructura:
NAME    GSS_CODE    HECTARES    NONLD_AREA  ONS_INNER   SUB_2009    SUB_2006    geometry
0   Kingston upon Thames    E09000021   3726.117    0.000   F   None    None    POLYGON ((516401.6 160201.8, 516407.3 160210.5...
1   Croydon E09000008   8649.441    0.000   F   None    None    POLYGON ((535009.2 159504.7, 535005.5 159502, ...
2   Bromley E09000006   15013.487   0.000   F   None    None    POLYGON ((540373.6 157530.4, 540361.2 157551.9...
Mi problema es que obtengo la siguiente gráfica en donde no aparecen los puntos del df2, ¿como puedo corregir el código para visualizarlos? ¿Cómo hacer la figura más grande?
Muchas gracias.
