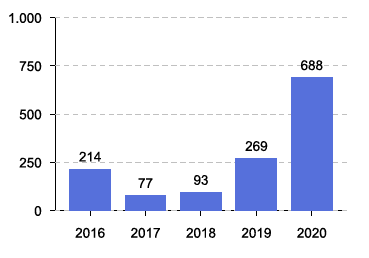
tengo un problema al generar un reporte con varios registros de personas, en el cual pinto una grafica de scores tipo BarChart como este:
La gráfica esta en un detail band, ya que se debe pintar por cada persona que venga en los registros.
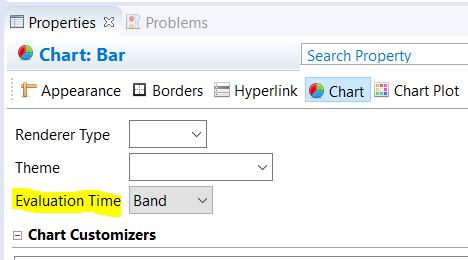
El problema está en que cuando son varios registros, las gráficas pintan el mismo valor para todas las personas, lo cual esta mal. Estoy usando jaspersoft studio 6.6 y spring boot.
<barChart>
                <chart isShowLegend="false" evaluationTime="Report">
                    <reportElement isPrintRepeatedValues="false" x="191" y="194" width="170" height="110" uuid="65065fea-fdcc-447d-8f6a-84f741e1a563"/>
                    <chartTitle/>
                    <chartSubtitle/>
                    <chartLegend/>
                </chart>
                <categoryDataset>
                    <dataset>
                        <datasetRun subDataset="dataSetScore" uuid="d1192fc3-de24-49be-baf6-c028bc66146b">
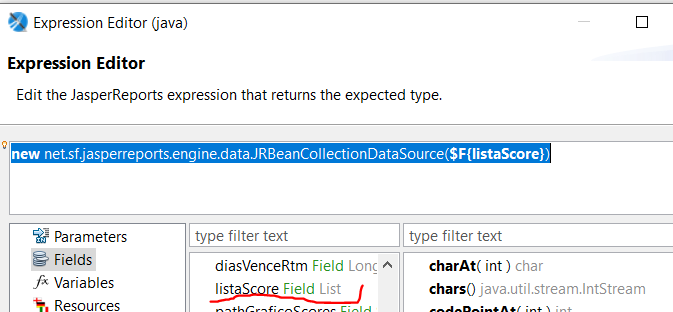
                            <dataSourceExpression><![CDATA[new net.sf.jasperreports.engine.data.JRBeanCollectionDataSource($F{listaScore})]]></dataSourceExpression>
                        </datasetRun>
                    </dataset>
                    <categorySeries>
                        <seriesExpression><![CDATA["SERIES 1"]]></seriesExpression>
                        <categoryExpression><![CDATA[$F{anio}]]></categoryExpression>
                        <valueExpression><![CDATA[$F{score}]]></valueExpression>
                    </categorySeries>
                </categoryDataset>
                <barPlot isShowLabels="true" isShowTickLabels="true" isShowTickMarks="true">
                    <plot>
                        <seriesColor seriesOrder="0" color="#5670DB"/>
                    </plot>
                    <itemLabel color="#000000">
                        <font size="6"/>
                    </itemLabel>
                    <categoryAxisFormat>
                        <axisFormat labelColor="#000000" tickLabelColor="#000000" verticalTickLabels="true" axisLineColor="#000000">
                            <labelFont>
                                <font size="7"/>
                            </labelFont>
                            <tickLabelFont>
                                <font size="6"/>
                            </tickLabelFont>
                        </axisFormat>
                    </categoryAxisFormat>
                    <valueAxisFormat>
                        <axisFormat labelColor="#000000" tickLabelColor="#000000" axisLineColor="#000000">
                            <labelFont>
                                <font size="6"/>
                            </labelFont>
                            <tickLabelFont>
                                <font size="6"/>
                            </tickLabelFont>
                        </axisFormat>
                    </valueAxisFormat>
                    <rangeAxisMinValueExpression><![CDATA[0]]></rangeAxisMinValueExpression>
                    <rangeAxisMaxValueExpression><![CDATA[1000]]></rangeAxisMaxValueExpression>
                </barPlot>
            </barChart>


