2

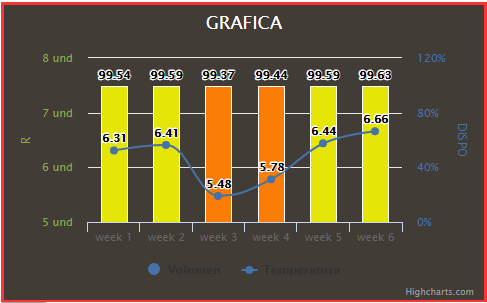
estoy haciendo unas graficas en highcharts con doble eje Y, y me muestra los valores de la siguiente manera:

introducir la descripción de la imagen aquí

pero lo que pasa es que como los valores del eje Y (lado derecho) tiene diferencias minimas, que estan entre 100 y 99, y no se nota las diferencias de las graficas.

habra alguna manera de especificar que solo me tome desde 99 a 100 y no desde 0 a 120 como sale en la imagen?

este es mi codigo

  <script type="text/javascript">
   $(function () {
    $('#container').highcharts({
        chart: {
            zoomType: 'xy',
            width: 480,
            height:295,
            backgroundColor: '#423C37',
        },
        title: {
            text: 'GRAFICA',
            style: {
                    color: '#FFFFFF'
                }
        },/*
        subtitle: {
            text: 'Source: WorldClimate.com'
        },*/
        xAxis: [{
            categories: [<?php for ($i=1; $i <=$c ; $i++) { 
                echo "'week ".$i."',";
            } ?>]
        }],
        yAxis: [{ // Primary yAxis
            labels: {
                format: '{value} und',
                style: {
                    color: '#89A54E'
                }
            },
            title: {
                text: 'R',
                style: {
                    color: '#89A54E'
                }
            }
        }, { // Secondary yAxis
            title: {
                text: 'DISPO',
                style: {
                    color: '#4572A7'
                }
            },
            labels: {
                format: '{value}%',
                style: {
                    color: '#4572A7'
                }
            },
            opposite: true
        }],
        tooltip: {
            shared: true,
            enabled: true,
        },
        /*legend: {
            layout: 'vertical',
            align: 'left',
            x: 120,
            verticalAlign: 'top',
            y: 100,
            floating: true,
            backgroundColor: '#ff0000'
        },*/
        series: [{
            name: 'Volumen',
            color: '#4572A7',
            dataLabels: {
                    enabled: true
                },
            type: 'column',
            yAxis: 1,
            data: [
            <?php for ($i=0; $i <$c ; $i++) {  ?>
            {
                y: <?php echo $valor_grafico[$i].","; ?>                    
                color: <?php if ($valor_grafico[$i]>=99.9) { echo "'#2aa714',"; }
                if ($valor_grafico[$i]<99.9 && $valor_grafico[$i]>=99.5) { echo "'#e5e507',"; }
                if ($valor_grafico[$i]<99.5 && $valor_grafico[$i]>=99.0) {echo "'#FA7D08',"; }
                if ($valor_grafico[$i]<99.0) {echo "'#e61b06',"; } ?>
            },
            <?php } ?> 
            ],
            tooltip: {
                valueSuffix: ' %'
            }

        }, {
            name: 'Temperatura',
            color: '#4572A7',
            dataLabels: {
                    enabled: true
                },
            type: 'spline',
            data: <?php echo "[".$line."],"; ?>
            tooltip: {
                valueSuffix: 'und'
            }
        }]
    });
});


    </script>
1 respuesta 1

3

Intenta con max y min asi:

$(function () {
    $('#container').highcharts({
        chart: {
            zoomType: 'xy',
            width: 480,
            height:295,
            backgroundColor: '#423C37'
        },
        title: {
            text: 'GRAFICA',
            style: {
                    color: '#FFFFFF'
                }
        },/*
        subtitle: {
            text: 'Source: WorldClimate.com'
        },*/
        xAxis: [
            {categories:['week1', 'week2','week3','week4','week5','week6']}]
        ,
        yAxis: [{ // Primary yAxis
            labels: {
                format: '{value} und',
                style: {
                    color: '#89A54E'
                }
            },
            title: {
                text: 'R',
                style: {
                    color: '#89A54E'
                }
            }
        }, { // Secondary yAxis
            title: {
                text: 'DISPO',
                style: {
                    color: '#4572A7'
                }
            },
            labels: {
                format: '{value}%',
                style: {
                    color: '#4572A7'
                }
            },
            opposite: true,
            max: 100,
            min: 99,
            startOnTick: false
        }],
        tooltip: {
            shared: true,
            enabled: true,
        },            
        series: [{
            name: 'Volumen',
            color: '#4572A7',
            dataLabels: {
                    enabled: true
                },
            type: 'column',
            yAxis: 1,
            data: [
            99.54,99.59,99.37,99.4,99.59,99.63
            ],
            tooltip: {
                valueSuffix: ' %'
            }

        }, {
            name: 'Temperatura',
            color: '#4572A7',
            dataLabels: {
                    enabled: true
                },
            type: 'spline',
            data: [6.31,6.41,5.48,5.78,6.44,6.66],
            tooltip: {
                valueSuffix: 'und'
            }
        }]
    });
});
<script src="https://ajax.googleapis.com/ajax/libs/jquery/3.3.1/jquery.min.js"></script>
<script src="https://code.highcharts.com/highcharts.js"></script>
<link rel="stylesheet" href="https://code.highcharts.com/css/highcharts.css">

<div id="container"></div>

2
  • alan, me esta pasando lo mismo que en lo que tu mandaste, el highcharts no respeta el maximo y minimo que se establece, x ejemplo tu pusiste tu minimo 99, y te puso que tu minimo es 98.8. en mi caso yo estoy especificando para la parte de "R", pongo mi maximo es 10 y mi minimo es 0, y me marca desde 0 hasta 12. habra alguna manera de que me limite a lo que yo especifique en el MAX y MIN?
    – user83889
    Commented el 7 nov. 2018 a las 17:53
  • Agrega startOnTick: false, ya edite mi respuesta.
    – alanfcm
    Commented el 7 nov. 2018 a las 18:17

Tu Respuesta

By clicking “Publica tu respuesta”, you agree to our terms of service and acknowledge you have read our privacy policy.

¿No es la respuesta que buscas? Examina otras preguntas con la etiqueta o formula tu propia pregunta.