Este es el código de un reproductor de audio (.wav), que usa Matplotlib para graficar el espectro, que he estado modificando:
import matplotlib
import pyaudio
import wave
import sys
import numpy as np

import multiprocessing

duration = 12.5
filename = '1.wav'

wf = wave.open(filename, 'rb')

def dB(a,base=1.0):
    return 10.0*np.log10(a/base)

fs = wf.getframerate()
bytes_per_sample = wf.getsampwidth()
bits_per_sample  = bytes_per_sample * 8
dtype = 'int{0}'.format(bits_per_sample)
channels = wf.getnchannels()

def audiostream(queue, n_channels, sampling, n_bytes_per_sample):
    # open stream
    p = pyaudio.PyAudio()

    stream = p.open(format =
                    p.get_format_from_width(n_bytes_per_sample),
                    channels = n_channels,
                    rate = sampling,
                    output = True)


    while True:
        data = queue.get()
        print ("input latency: {0}".format(stream.get_input_latency()))
        print ("output latency: {0}".format(stream.get_output_latency()))
        print ("avail read: {0}".format(stream.get_read_available()))
        print ("avail write: {0}".format(stream.get_write_available()))
        if data == 'Stop':
            break
        stream.write(data)
    stream.close()

Q = multiprocessing.Queue()
audio_process = multiprocessing.Process(target=audiostream, args=(Q,channels,fs,bytes_per_sample))
audio_process.start()
# audio_process.join()
# stream = Q.get()
# audio_process.join()

# read data
audio = np.fromstring(wf.readframes(int(duration*fs*bytes_per_sample/channels)), dtype=dtype)
audio.shape = (audio.shape[0]/channels, channels)

ch_left = 0
ch_right = 1

ch = ch_right

audio_fft = np.fft.fft(audio[:,ch])
freqs = np.fft.fftfreq(audio[:,ch].shape[0], 1.0/fs) / 1000.0
max_freq_kHz = freqs.max()
times = np.arange(audio.shape[0]) / float(fs)
fftshift = np.fft.fftshift

import matplotlib.pyplot as plt
fig = plt.figure(figsize=(8.5,11))
ax_spec_gram = fig.add_subplot(311)
ax_fft  = fig.add_subplot(312)
ax_time = fig.add_subplot(313)

ax_spec_gram.specgram(audio[:,ch], Fs=fs, cmap='gist_heat')
ax_spec_gram.set_xlim(0,duration)
ax_spec_gram.set_ylim(0,max_freq_kHz*1000.0)
ax_spec_gram.set_ylabel('Frequency (Hz)')

ax_fft.plot(fftshift(freqs), fftshift(dB(audio_fft)))
ax_fft.set_xlim(0,max_freq_kHz)
ax_fft.set_xlabel('Frequency (kHz)')
ax_fft.set_ylabel('dB')

ax_time.plot(times, audio[:,ch])
ax_time.set_xlabel('Time (s)')
ax_time.set_xlim(0,duration)
ax_time.set_ylim(-32768,32768)

time_posn, = ax_time.plot([0,0], [-32768,32768], 'k')
spec_posn, = ax_spec_gram.plot([0,0], [0, max_freq_kHz*1000.0], 'k')


class AudioSubsetter(object):
    def __init__(self, audio_array, audio_device_queue, n_channels, sampling_rate, n_bytes_per_sample, chunk_dt=0.1):
        self.last_chunk = -1
        self.queue = audio_device_queue
        self.audio_dat = audio_array.tostring()
        self.to_t = 1.0/(sampling_rate*n_channels*n_bytes_per_sample)
        chunk = int(chunk_dt*fs)*channels*bytes_per_sample
        self.chunk0 = np.arange(0, len(self.audio_dat), chunk, dtype=int)
        self.chunk1 = self.chunk0 + chunk

    def update(self, *args):
        """ Timer callback for audio position indicator. Called with """
        self.last_chunk +=1
        if self.last_chunk >= len(self.chunk0):
            # self.queue.put("Stop")
            self.last_chunk = 0

        i = self.last_chunk
        i0, i1 = self.chunk0[i], self.chunk1[i]
        self.queue.put(self.audio_dat[i0:i1])
        t0, t1 = i0*self.to_t, i1*self.to_t
        print( t0, t1)
        for line_artist in args:
            line_artist.set_xdata([t1,t1])
        args[0].figure.canvas.draw()


print ("Setting up audio process")
dt = .5
playhead = AudioSubsetter(audio, Q, channels, fs, bytes_per_sample, chunk_dt=dt)
timer = fig.canvas.new_timer(interval=dt*1000.0)
timer.add_callback(playhead.update, spec_posn, time_posn)
timer.start()

plt.show()
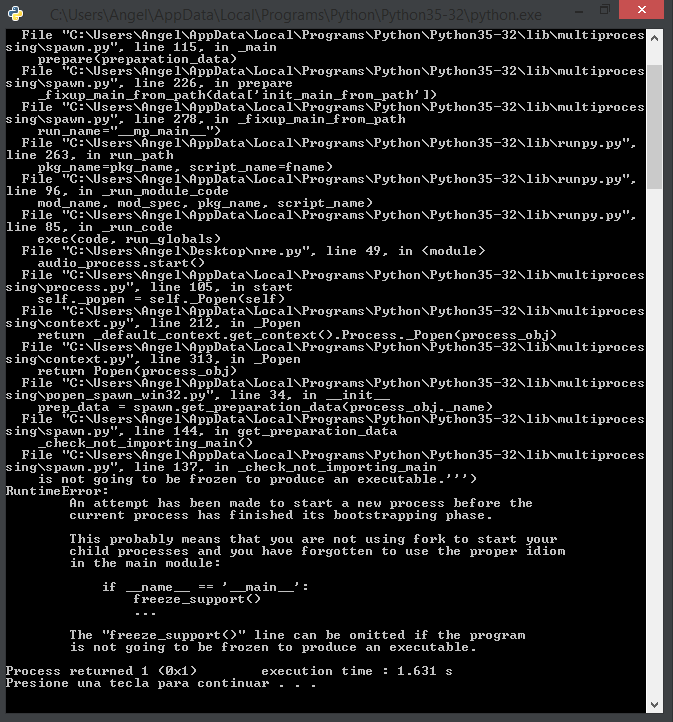
el problema es que al ejecutarlo en Windows obtengo un Runtime Error:
Espero puedan ayudarme.
