1

Tengo el siguiente código:

%matplotlib inline
from pandas import *
import matplotlib.pyplot as plt
import numpy as np
import pandas as pd
import matplotlib.pyplot as plt
import seaborn as sns

X = pd.read_csv(r'C:Path.csv', encoding='latin1')

IDNivelEducativo_Programas = X.groupby(['ID_Nivel_Educativo','Programas_Conocidos']).size()

IDNivelEducativo_Programas = IDNivelEducativo_Programas.reset_index()

IDNivelEducativo_Programas = pd.pivot_table(IDNivelEducativo_Programas, columns = 'ID_Nivel_Educativo', index = 'Programas_Conocidos', values = 0)

IDNivelEducativo_Programas.plot(kind = 'bar', stacked = True)

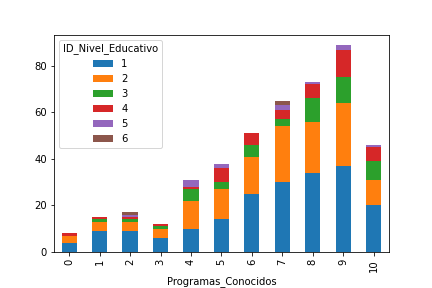
Y el resultado es este gráfico:

introducir la descripción de la imagen aquí

¿Alguien sabe cómo añadir los rótulos de valores numéricos para cada color en cada barra? Agradezco cualquier ayuda :D
1 respuesta 1

0

No es mi código, pero te podría servir esta función, que permite usar los valores y ubicarlos encima de cada barra:

def add_value_labels(ax, spacing=5):
"""(Not my code) Add labels to the end of each bar in a bar chart.

Arguments:
    ax (matplotlib.axes.Axes): The matplotlib object containing the axes
        of the plot to annotate.
    spacing (int): The distance between the labels and the bars.
"""

# For each bar: Place a label
for rect in ax.patches:
    # Get X and Y placement of label from rect.
    y_value = rect.get_height()
    x_value = rect.get_x() + rect.get_width() / 2

    # Number of points between bar and label. Change to your liking.
    space = spacing
    # Vertical alignment for positive values
    va = 'bottom'

    # If value of bar is negative: Place label below bar
    if y_value < 0:
        # Invert space to place label below
        space *= -1
        # Vertically align label at top
        va = 'top'

    # Use Y value as label and format number with zero decimal place
    label = "{:.0f}".format(y_value)

    # Create annotation
    ax.annotate(
        label,                      # Use `label` as label
        (x_value, y_value),         # Place label at end of the bar
        xytext=(0, space),          # Vertically shift label by `space`
        textcoords="offset points", # Interpret `xytext` as offset in points
        ha='center',                # Horizontally center label
        va=va)                      # Vertically align label differently for
                                    # positive and negative values.

Tu Respuesta

By clicking “Publica tu respuesta”, you agree to our terms of service and acknowledge you have read our privacy policy.

¿No es la respuesta que buscas? Examina otras preguntas con la etiqueta o formula tu propia pregunta.