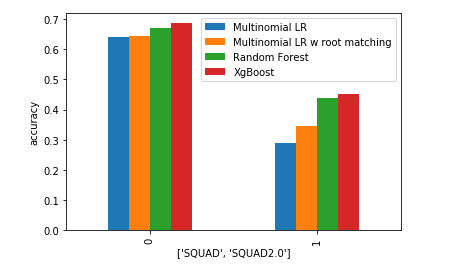
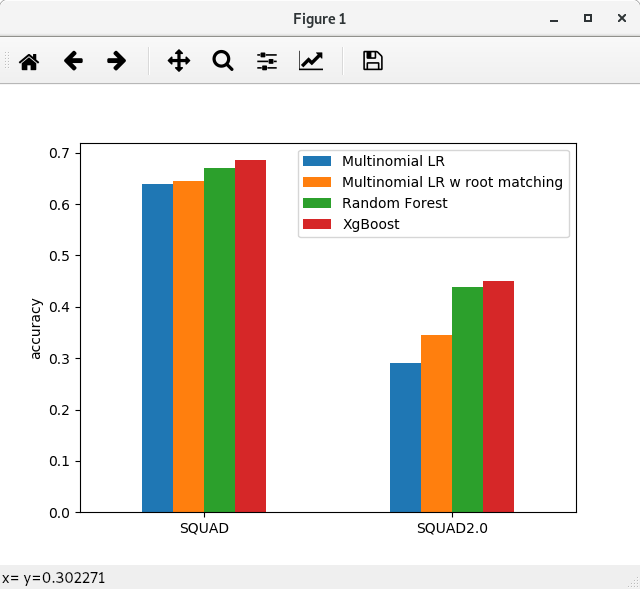
Intenté jugar con plt.xlabel pero solo agrega una nueva línea.
import matplotlib.pyplot as plt
import numpy as np, pandas as pd
# import seaborn as sns

data = [[0.639803, 0.289809], [0.644972, 0.345364],[0.670641,0.437721],[0.685562,0.450460]]

index =["Multinomial LR","Multinomial LR w root matching","Random Forest","XgBoost"]
df = pd.DataFrame(data=data, index = index)
print(df)
xlabel = ["SQUAD","SQUAD2.0"]
df.T.plot.bar()
plt.ylabel('accuracy')
#plt.set_xlabel(x_label)
plt.xlabel(xlabel,rotation=0)
plt.show()
Claramente quiero deshacerme de 0 y 1 para poner el contenido de Xlabel.
Tambien intenté inspirarme con la galería oficial con
fig, axs = plt.subplots(1, figsize=(5, 5), sharey=True)
axs[0].bar(xlabel, data)
fig.suptitle('Categorical Plotting')
Pero aqui las columnas no aparecen porque hay un TypeError: 'AxesSubplot' object does not support indexing

