cuerpo editado
Origen Enlace

llevoLlevo ya un par de horas intentando agregar los data labels a un gráfico de excel online mediante un script, este mismo script lo pienso utilizar en un flujo para optimizar los reportes en la empresa que trabajo. Para ello eh estado intentando utilizar la función de record actions sin embargo parece no funcionar cuando lo ejecuto en el flow parece no funcionar. He intentado usar chart.getDataLabels().setPosition(ExcelScript.ChartDataLabelPosition.outsideEnd); inclusive e intentado usar chart_1.getDataLabels().setShowValue(true); sin embargo parece que ninguno de estos códigos funcionan.

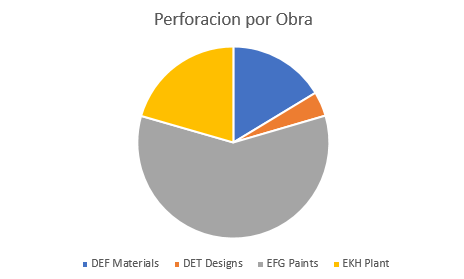
Para darles una idea de lo que busco, les anexo algunas fotos: Lo que tengo
Lo que busco

Bueno eso es lo que busco crear mediante un script en excel. Por ahora mi script es el siguiente:

function main(workbook: ExcelScript.Workbook) {
// Delete the "TESTING" worksheet if it's present, then recreate it.
workbook.getWorksheet('TESTING')?.delete();
// Add a new worksheet
let probando = workbook.addWorksheet("TESTING");
let table1 = workbook.getTable("Table1");
// Add a new pivot table on probando
let newPivotTable = workbook.addPivotTable("PivotTable1", table1, probando.getRange("A1:C18"));
// Add pivot field to a hierarchy in newPivotTable
newPivotTable.addRowHierarchy(newPivotTable.getHierarchy("Customer Name"));
// Add pivot field to a hierarchy in newPivotTable
newPivotTable.addDataHierarchy(newPivotTable.getHierarchy("Amount due"));

let selectedSheet = workbook.getWorksheet("TESTING");
// Insert pivot chart on sheet selectedSheet
let chart_1 = selectedSheet.addChart(ExcelScript.ChartType.pie, newPivotTable.getLayout().getRange());
// Resize and move chart chart_1
chart_1.setLeft(218.25);
chart_1.setTop(0);
chart_1.setWidth(360);
chart_1.setHeight(216);
chart_1.getTitle().setText('Perforacion por Obra');}

Y esta vendría a ser mi tabla normal (Table1): Tabla Excel

El nombre del worksheet es InvoiceAmounts. Bueno espero que me puedan ayudar, les agradezco de antemano.
llevo ya un par de horas intentando agregar los data labels a un gráfico de excel online mediante un script, este mismo script lo pienso utilizar en un flujo para optimizar los reportes en la empresa que trabajo. Para ello eh estado intentando utilizar la función de record actions sin embargo parece no funcionar cuando lo ejecuto en el flow parece no funcionar. He intentado usar chart.getDataLabels().setPosition(ExcelScript.ChartDataLabelPosition.outsideEnd); inclusive e intentado usar chart_1.getDataLabels().setShowValue(true); sin embargo parece que ninguno de estos códigos funcionan.

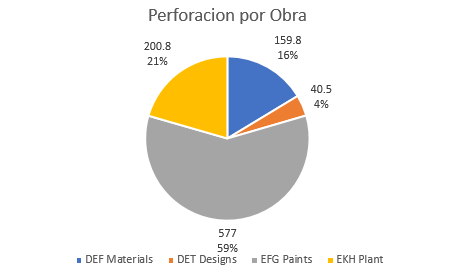
Para darles una idea de lo que busco, les anexo algunas fotos: Lo que tengo

Lo que busco

Bueno eso es lo que busco crear mediante un script en excel. Por ahora mi script es el siguiente:

function main(workbook: ExcelScript.Workbook) {
// Delete the "TESTING" worksheet if it's present, then recreate it.
workbook.getWorksheet('TESTING')?.delete();
// Add a new worksheet
let probando = workbook.addWorksheet("TESTING");
let table1 = workbook.getTable("Table1");
// Add a new pivot table on probando
let newPivotTable = workbook.addPivotTable("PivotTable1", table1, probando.getRange("A1:C18"));
// Add pivot field to a hierarchy in newPivotTable
newPivotTable.addRowHierarchy(newPivotTable.getHierarchy("Customer Name"));
// Add pivot field to a hierarchy in newPivotTable
newPivotTable.addDataHierarchy(newPivotTable.getHierarchy("Amount due"));

let selectedSheet = workbook.getWorksheet("TESTING");
// Insert pivot chart on sheet selectedSheet
let chart_1 = selectedSheet.addChart(ExcelScript.ChartType.pie, newPivotTable.getLayout().getRange());
// Resize and move chart chart_1
chart_1.setLeft(218.25);
chart_1.setTop(0);
chart_1.setWidth(360);
chart_1.setHeight(216);
chart_1.getTitle().setText('Perforacion por Obra');}

Y esta vendría a ser mi tabla normal (Table1): Tabla Excel

El nombre del worksheet es InvoiceAmounts. Bueno espero que me puedan ayudar, les agradezco de antemano.

Llevo ya un par de horas intentando agregar los data labels a un gráfico de excel online mediante un script, este mismo script lo pienso utilizar en un flujo para optimizar los reportes en la empresa que trabajo. Para ello eh estado intentando utilizar la función de record actions sin embargo parece no funcionar cuando lo ejecuto en el flow parece no funcionar. He intentado usar chart.getDataLabels().setPosition(ExcelScript.ChartDataLabelPosition.outsideEnd); inclusive e intentado usar chart_1.getDataLabels().setShowValue(true); sin embargo parece que ninguno de estos códigos funcionan.

Para darles una idea de lo que busco, les anexo algunas fotos: Lo que tengo

Lo que busco

Bueno eso es lo que busco crear mediante un script en excel. Por ahora mi script es el siguiente:

function main(workbook: ExcelScript.Workbook) {
// Delete the "TESTING" worksheet if it's present, then recreate it.
workbook.getWorksheet('TESTING')?.delete();
// Add a new worksheet
let probando = workbook.addWorksheet("TESTING");
let table1 = workbook.getTable("Table1");
// Add a new pivot table on probando
let newPivotTable = workbook.addPivotTable("PivotTable1", table1, probando.getRange("A1:C18"));
// Add pivot field to a hierarchy in newPivotTable
newPivotTable.addRowHierarchy(newPivotTable.getHierarchy("Customer Name"));
// Add pivot field to a hierarchy in newPivotTable
newPivotTable.addDataHierarchy(newPivotTable.getHierarchy("Amount due"));

let selectedSheet = workbook.getWorksheet("TESTING");
// Insert pivot chart on sheet selectedSheet
let chart_1 = selectedSheet.addChart(ExcelScript.ChartType.pie, newPivotTable.getLayout().getRange());
// Resize and move chart chart_1
chart_1.setLeft(218.25);
chart_1.setTop(0);
chart_1.setWidth(360);
chart_1.setHeight(216);
chart_1.getTitle().setText('Perforacion por Obra');}

Y esta vendría a ser mi tabla normal (Table1): Tabla Excel

El nombre del worksheet es InvoiceAmounts. Bueno espero que me puedan ayudar, les agradezco de antemano.

se añadió 1 carácter en el cuerpo
Origen Enlace

llevo ya un par de horas intentando agregar los data labels a un gráfico de excel online mediante un script, este mismo script lo pienso utilizar en un flujo para optimizar los reportes en la empresa que trabajo. Para ello eh estado intentando utilizar la función de record actions sin embargo parece no funcionar cuando lo ejecuto en el flow parece no funcionar. He intentado usar chart.getDataLabels().setPosition(ExcelScript.ChartDataLabelPosition.outsideEnd); inclusive e intentado usar chart_1.getDataLabels().setShowValue(true); sin embargo parece que ninguno de estos códigos funcionan.

Para darles una idea de lo que busco, les anexo algunas fotos: Lo que tengo

Lo que busco

Bueno eso es lo que busco crear mediante un script en excel. Por ahora mi script es el siguiente:

function main(workbook: ExcelScript.Workbook) {
// Delete the "TESTING" worksheet if it's present, then recreate it.
workbook.getWorksheet('TESTING')?.delete();
// Add a new worksheet
let probando = workbook.addWorksheet("TESTING");
let table1 = workbook.getTable("Table1");
// Add a new pivot table on probando
let newPivotTable = workbook.addPivotTable("PivotTable1", table1, probando.getRange("A1:C18"));
// Add pivot field to a hierarchy in newPivotTable
newPivotTable.addRowHierarchy(newPivotTable.getHierarchy("Customer Name"));
// Add pivot field to a hierarchy in newPivotTable
newPivotTable.addDataHierarchy(newPivotTable.getHierarchy("Amount due"));

let selectedSheet = workbook.getWorksheet("TESTING");
// Insert pivot chart on sheet selectedSheet
let chart_1 = selectedSheet.addChart(ExcelScript.ChartType.pie, newPivotTable.getLayout().getRange());
// Resize and move chart chart_1
chart_1.setLeft(218.25);
chart_1.setTop(0);
chart_1.setWidth(360);
chart_1.setHeight(216);
chart_1.getTitle().setText('Perforacion por Obra');}

Y esta vendría a ser mi tabla normal (Table1): Tabla Excel

El nombre del worksheet es InvoiceAmounts. Bueno espero que me puedan ayudar, les agradezco de antemano.

llevo ya un par de horas intentando agregar los data labels a un gráfico de excel online mediante un script, este mismo script lo pienso utilizar en un flujo para optimizar los reportes en la empresa que trabajo. Para ello eh estado intentando utilizar la función de record actions sin embargo parece no funcionar cuando lo ejecuto en el flow parece no funcionar. He intentado usar chart.getDataLabels().setPosition(ExcelScript.ChartDataLabelPosition.outsideEnd); inclusive e intentado usar chart_1.getDataLabels().setShowValue(true); sin embargo parece que ninguno de estos códigos funcionan.

Para darles una idea de lo que busco, les anexo algunas fotos: Lo que tengo

Lo que busco

Bueno eso es lo que busco crear mediante un script en excel. Por ahora mi script es el siguiente:

function main(workbook: ExcelScript.Workbook) {
// Delete the "TESTING" worksheet if it's present, then recreate it.
workbook.getWorksheet('TESTING')?.delete();
// Add a new worksheet
let probando = workbook.addWorksheet("TESTING");
let table1 = workbook.getTable("Table1");
// Add a new pivot table on probando
let newPivotTable = workbook.addPivotTable("PivotTable1", table1, probando.getRange("A1:C18"));
// Add pivot field to a hierarchy in newPivotTable
newPivotTable.addRowHierarchy(newPivotTable.getHierarchy("Customer Name"));
// Add pivot field to a hierarchy in newPivotTable
newPivotTable.addDataHierarchy(newPivotTable.getHierarchy("Amount due"));

let selectedSheet = workbook.getWorksheet("TESTING");
// Insert pivot chart on sheet selectedSheet
let chart_1 = selectedSheet.addChart(ExcelScript.ChartType.pie, newPivotTable.getLayout().getRange());
// Resize and move chart chart_1
chart_1.setLeft(218.25);
chart_1.setTop(0);
chart_1.setWidth(360);
chart_1.setHeight(216);
chart_1.getTitle().setText('Perforacion por Obra');}

Y esta vendría a ser mi tabla normal (Table1): Tabla Excel

El nombre del worksheet es InvoiceAmounts. Bueno espero que me puedan ayudar, les agradezco de antemano

llevo ya un par de horas intentando agregar los data labels a un gráfico de excel online mediante un script, este mismo script lo pienso utilizar en un flujo para optimizar los reportes en la empresa que trabajo. Para ello eh estado intentando utilizar la función de record actions sin embargo parece no funcionar cuando lo ejecuto en el flow parece no funcionar. He intentado usar chart.getDataLabels().setPosition(ExcelScript.ChartDataLabelPosition.outsideEnd); inclusive e intentado usar chart_1.getDataLabels().setShowValue(true); sin embargo parece que ninguno de estos códigos funcionan.

Para darles una idea de lo que busco, les anexo algunas fotos: Lo que tengo

Lo que busco

Bueno eso es lo que busco crear mediante un script en excel. Por ahora mi script es el siguiente:

function main(workbook: ExcelScript.Workbook) {
// Delete the "TESTING" worksheet if it's present, then recreate it.
workbook.getWorksheet('TESTING')?.delete();
// Add a new worksheet
let probando = workbook.addWorksheet("TESTING");
let table1 = workbook.getTable("Table1");
// Add a new pivot table on probando
let newPivotTable = workbook.addPivotTable("PivotTable1", table1, probando.getRange("A1:C18"));
// Add pivot field to a hierarchy in newPivotTable
newPivotTable.addRowHierarchy(newPivotTable.getHierarchy("Customer Name"));
// Add pivot field to a hierarchy in newPivotTable
newPivotTable.addDataHierarchy(newPivotTable.getHierarchy("Amount due"));

let selectedSheet = workbook.getWorksheet("TESTING");
// Insert pivot chart on sheet selectedSheet
let chart_1 = selectedSheet.addChart(ExcelScript.ChartType.pie, newPivotTable.getLayout().getRange());
// Resize and move chart chart_1
chart_1.setLeft(218.25);
chart_1.setTop(0);
chart_1.setWidth(360);
chart_1.setHeight(216);
chart_1.getTitle().setText('Perforacion por Obra');}

Y esta vendría a ser mi tabla normal (Table1): Tabla Excel

El nombre del worksheet es InvoiceAmounts. Bueno espero que me puedan ayudar, les agradezco de antemano.

Origen Enlace

Como agregar Data Labels a gráficos en Office Script?

llevo ya un par de horas intentando agregar los data labels a un gráfico de excel online mediante un script, este mismo script lo pienso utilizar en un flujo para optimizar los reportes en la empresa que trabajo. Para ello eh estado intentando utilizar la función de record actions sin embargo parece no funcionar cuando lo ejecuto en el flow parece no funcionar. He intentado usar chart.getDataLabels().setPosition(ExcelScript.ChartDataLabelPosition.outsideEnd); inclusive e intentado usar chart_1.getDataLabels().setShowValue(true); sin embargo parece que ninguno de estos códigos funcionan.

Para darles una idea de lo que busco, les anexo algunas fotos: Lo que tengo

Lo que busco

Bueno eso es lo que busco crear mediante un script en excel. Por ahora mi script es el siguiente:

function main(workbook: ExcelScript.Workbook) {
// Delete the "TESTING" worksheet if it's present, then recreate it.
workbook.getWorksheet('TESTING')?.delete();
// Add a new worksheet
let probando = workbook.addWorksheet("TESTING");
let table1 = workbook.getTable("Table1");
// Add a new pivot table on probando
let newPivotTable = workbook.addPivotTable("PivotTable1", table1, probando.getRange("A1:C18"));
// Add pivot field to a hierarchy in newPivotTable
newPivotTable.addRowHierarchy(newPivotTable.getHierarchy("Customer Name"));
// Add pivot field to a hierarchy in newPivotTable
newPivotTable.addDataHierarchy(newPivotTable.getHierarchy("Amount due"));

let selectedSheet = workbook.getWorksheet("TESTING");
// Insert pivot chart on sheet selectedSheet
let chart_1 = selectedSheet.addChart(ExcelScript.ChartType.pie, newPivotTable.getLayout().getRange());
// Resize and move chart chart_1
chart_1.setLeft(218.25);
chart_1.setTop(0);
chart_1.setWidth(360);
chart_1.setHeight(216);
chart_1.getTitle().setText('Perforacion por Obra');}

Y esta vendría a ser mi tabla normal (Table1): Tabla Excel

El nombre del worksheet es InvoiceAmounts. Bueno espero que me puedan ayudar, les agradezco de antemano