se añadieron 483 caracteres en el cuerpo
Origen Enlace

Suavizado (Alisado o simplificado) de polígonos en mapa con ggplot2 y sf

¿Cómo se pueden suavizar los polígonos de un mapa producido con ggplot y sf?

He utilizado el package sf para extraer los polígonos de un archivo shapefile

geomunicipios <- st_read("ruta/archivo.shp")
Reading layer `archivo' from data source 
  `ruta\archivo.shp' 
  using driver `ESRI Shapefile'
Simple feature collection with 45 features and 10 fields
Geometry type: MULTIPOLYGON
Dimension:     XY
Bounding box:  xmin: -2.344411 ymin: 37.37375 xmax: -0.647983 ymax: 38.75509
Geodetic CRS:  WGS 84

Y ggplot2 para trazar el mapa:

rmurcia <- ggplot(data = geomunicipios) + 
 geom_sf(aes(fill=columna),color="#FFFFFF",size=1)

introducir la descripción de la imagen aquí

RESUELTO

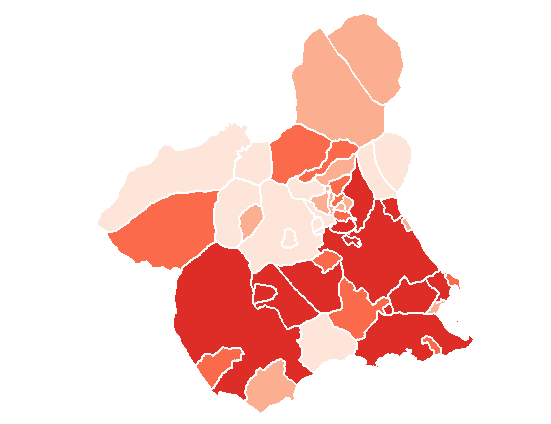
Resuelto con package smoothr y aplicando la función smooth al dataframe sf que contiene las geometrías de los polígonos y a continuación trazamos el mapa:


geosmunicipios <- smooth(geomunicipios, method = "ksmooth", smoothness = 12)

rmurcia <- ggplot(data = geosmunicipios) + 
 geom_sf(aes(fill=columna),color="#FFFFFF",size=1)
introducir la descripción de la imagen aquí

Suavizado de polígonos en mapa con ggplot2 y sf

¿Cómo se pueden suavizar los polígonos de un mapa producido con ggplot y sf?

He utilizado el package sf para extraer los polígonos de un archivo shapefile

geomunicipios <- st_read("ruta/archivo.shp")
Reading layer `archivo' from data source 
  `ruta\archivo.shp' 
  using driver `ESRI Shapefile'
Simple feature collection with 45 features and 10 fields
Geometry type: MULTIPOLYGON
Dimension:     XY
Bounding box:  xmin: -2.344411 ymin: 37.37375 xmax: -0.647983 ymax: 38.75509
Geodetic CRS:  WGS 84

Y ggplot2 para trazar el mapa:

rmurcia <- ggplot(data = geomunicipios) + 
 geom_sf(aes(fill=columna),color="#FFFFFF",size=1)

introducir la descripción de la imagen aquí

Suavizado (Alisado o simplificado) de polígonos en mapa con ggplot2 y sf

¿Cómo se pueden suavizar los polígonos de un mapa producido con ggplot y sf?

He utilizado el package sf para extraer los polígonos de un archivo shapefile

geomunicipios <- st_read("ruta/archivo.shp")
Reading layer `archivo' from data source 
  `ruta\archivo.shp' 
  using driver `ESRI Shapefile'
Simple feature collection with 45 features and 10 fields
Geometry type: MULTIPOLYGON
Dimension:     XY
Bounding box:  xmin: -2.344411 ymin: 37.37375 xmax: -0.647983 ymax: 38.75509
Geodetic CRS:  WGS 84

Y ggplot2 para trazar el mapa:

rmurcia <- ggplot(data = geomunicipios) + 
 geom_sf(aes(fill=columna),color="#FFFFFF",size=1)

introducir la descripción de la imagen aquí

RESUELTO

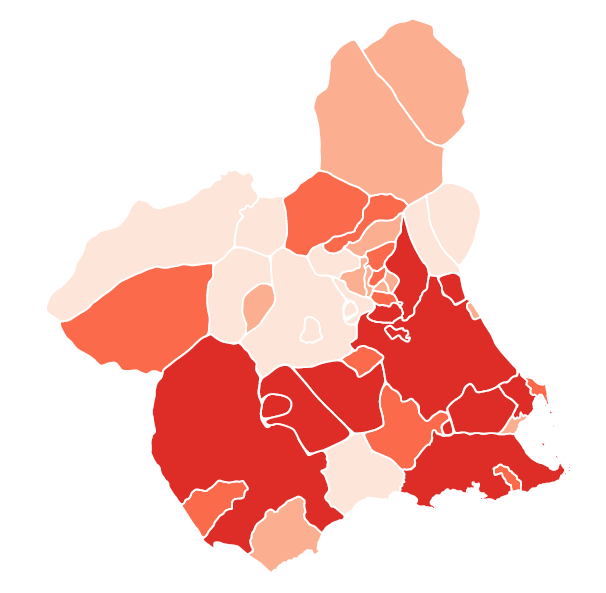
Resuelto con package smoothr y aplicando la función smooth al dataframe sf que contiene las geometrías de los polígonos y a continuación trazamos el mapa:


geosmunicipios <- smooth(geomunicipios, method = "ksmooth", smoothness = 12)

rmurcia <- ggplot(data = geosmunicipios) + 
 geom_sf(aes(fill=columna),color="#FFFFFF",size=1)
introducir la descripción de la imagen aquí

cuerpo editado
Origen Enlace

¿Cómo se pueden suavizar los polígonos de un mapa producido con ggplot y sf?

He utilizado el package sf para extraer los polígonos de un archivo shapefile

geomunicipios <- st_read("ruta/archivo.shp")
Reading layer `archivo' from data source 
  `ruta\archivo.shp' 
  using driver `ESRI Shapefile'
Simple feature collection with 45 features and 10 fields
Geometry type: MULTIPOLYGON
Dimension:     XY
Bounding box:  xmin: -2.344411 ymin: 37.37375 xmax: -0.647983 ymax: 38.75509
Geodetic CRS:  WGS 84

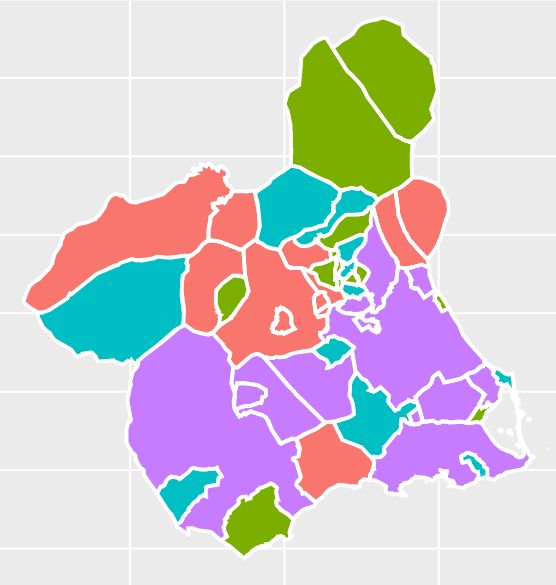
Y ggplot2 para trazar el mapa:

rmurcia <- ggplot(data = geomunicipios) + 
 geom_sf(aes(fill=columna),color="#FFFFFF",size=1)
introducir la descripción de la imagen aquíintroducir la descripción de la imagen aquí

¿Cómo se pueden suavizar los polígonos de un mapa producido con ggplot y sf?

He utilizado el package sf para extraer los polígonos de un archivo shapefile

geomunicipios <- st_read("ruta/archivo.shp")
Reading layer `archivo' from data source 
  `ruta\archivo.shp' 
  using driver `ESRI Shapefile'
Simple feature collection with 45 features and 10 fields
Geometry type: MULTIPOLYGON
Dimension:     XY
Bounding box:  xmin: -2.344411 ymin: 37.37375 xmax: -0.647983 ymax: 38.75509
Geodetic CRS:  WGS 84

Y ggplot2 para trazar el mapa:

rmurcia <- ggplot(data = geomunicipios) + 
 geom_sf(aes(fill=columna),color="#FFFFFF",size=1)

introducir la descripción de la imagen aquí

se añadieron 110 caracteres en el cuerpo
Origen Enlace

¿Cómo se pueden suavizar los polígonos de un mapa producido con ggplot y sf?

He utilizado el package sf para extraer los polígonos de un archivo shapefile

geomunicipios <- st_read("ruta/archivo.shp")
Reading layer `archivo' from data source 
  `ruta\archivo.shp' 
  using driver `ESRI Shapefile'
Simple feature collection with 45 features and 10 fields
Geometry type: MULTIPOLYGON
Dimension:     XY
Bounding box:  xmin: -2.344411 ymin: 37.37375 xmax: -0.647983 ymax: 38.75509
Geodetic CRS:  WGS 84

Y ggplot2 para trazar el mapa:

rmurcia <- ggplot(data = geomunicipios) + 
 geom_sf(aes(fill=columna),color="#FFFFFF",size=1)

introducir la descripción de la imagen aquí

¿Cómo se pueden suavizar los polígonos de un mapa producido con ggplot y sf?

He utilizado el package sf para extraer los polígonos de un archivo shapefile

geomunicipios <- st_read("ruta/archivo.shp")
Reading layer `archivo' from data source 
  `ruta\archivo.shp' 
  using driver `ESRI Shapefile'
Simple feature collection with 45 features and 10 fields
Geometry type: MULTIPOLYGON
Dimension:     XY
Bounding box:  xmin: -2.344411 ymin: 37.37375 xmax: -0.647983 ymax: 38.75509
Geodetic CRS:  WGS 84

Y ggplot2 para trazar el mapa:

rmurcia <- ggplot(data = geomunicipios) + 
 geom_sf(aes(fill=columna),color="#FFFFFF",size=1)

introducir la descripción de la imagen aquí

Origen Enlace
Loading