se añadieron 16 caracteres en el cuerpo
Origen Enlace
Patricio Moracho
  • 61.1k
  • 12
  • 42
  • 72

percent_first <- function(x) { x <- sprintf("%0.1f%%", round(x, digits = 1)) x }

percent_first <- function(x) {
  x <- sprintf("%0.1f%%", round(x, digits = 1))
  x
}


       sp<-ggplot() +
         geom_segment(
           data = gather(xdf, measure, val, -cat) %>% 
             group_by(cat) %>% 
             top_n(-1) %>% 
             slice(1) %>%
             ungroup(),
           aes(x = 0, xend = val, y = cat, yend = cat),
           linetype = "dotted", size = 0.5, color = "gray80"
         ) +
         geom_segment(
           data = gather(xdf, measure, val, -cat) %>% 
             group_by(cat) %>% 
             summarise(start = range(val)[1], end = range(val)[2]) %>% 
             ungroup(),
           aes(x = start, xend = end, y = cat, yend = cat),
           color = "gray80", size = 7.5
         ) +
         geom_text(color="black", size=6, vjust=2, hjust= 0.5,
        aes(x=xdf$`Valor máximo`, y=xdf$cat, label=percent_first(xdf$`Valor máximo`))) +
         geom_text(color="black", size=6, vjust=2, hjust= 0.5,
        aes(x=xdf$`Valor mínimo`, y=xdf$cat, label=percent_first(xdf$`Valor mínimo`))) +
         geom_text(color="black", size=6, vjust=2, hjust= 0.5,
        aes(x=xdf$`Valor medio`, y=xdf$cat, label=percent_first(xdf$`Valor medio`))) +
         geom_point(
           data = gather(xdf, measure, value, -cat),
           aes(value, cat, color = measure), 
           size = 10
         ) +
         scale_x_comma(position = "top", limits = c(-3, 100),labels = c("0%","25%","50%","75%","100%")) +
         scale_color_ipsum(name = "",breaks=c("Valor mínimo","Valor medio","Valor máximo")) +
         labs(
           x =NULL , y = "Fibrosis Pulmonar Progresiva por Etiología",
           title = ""
         ) +
         theme_ipsum_rc(grid = "X") +
         theme(
           plot.title=element_text(face="bold"),
           axis.title.x = element_text(face="bold"),
           axis.title.y = element_text(face="bold",size=13),
           panel.grid.major.y = element_blank(),
           legend.text = element_text(face="bold",size=13),
           legend.title = element_blank(),
           panel.border = element_blank(),
           legend.position = "top",
           axis.text.y = element_text(size = 13, face = "bold"),
           axis.text.x = element_text(size = 13, face = "bold"))
       

       sp+scale_color_manual(values = c("Valor mínimo" = "#ffff04", 
                             "Valor medio" = "#edea0f",                                 
                             "Valor máximo" = "#a0ce3a"))
percent_first <- function(x) { x <- sprintf("%0.1f%%", round(x, digits = 1)) x }

       sp<-ggplot() +
         geom_segment(
           data = gather(xdf, measure, val, -cat) %>% 
             group_by(cat) %>% 
             top_n(-1) %>% 
             slice(1) %>%
             ungroup(),
           aes(x = 0, xend = val, y = cat, yend = cat),
           linetype = "dotted", size = 0.5, color = "gray80"
         ) +
         geom_segment(
           data = gather(xdf, measure, val, -cat) %>% 
             group_by(cat) %>% 
             summarise(start = range(val)[1], end = range(val)[2]) %>% 
             ungroup(),
           aes(x = start, xend = end, y = cat, yend = cat),
           color = "gray80", size = 7.5
         ) +
         geom_text(color="black", size=6, vjust=2, hjust= 0.5,
        aes(x=xdf$`Valor máximo`, y=xdf$cat, label=percent_first(xdf$`Valor máximo`))) +
         geom_text(color="black", size=6, vjust=2, hjust= 0.5,
        aes(x=xdf$`Valor mínimo`, y=xdf$cat, label=percent_first(xdf$`Valor mínimo`))) +
         geom_text(color="black", size=6, vjust=2, hjust= 0.5,
        aes(x=xdf$`Valor medio`, y=xdf$cat, label=percent_first(xdf$`Valor medio`))) +
         geom_point(
           data = gather(xdf, measure, value, -cat),
           aes(value, cat, color = measure), 
           size = 10
         ) +
         scale_x_comma(position = "top", limits = c(-3, 100),labels = c("0%","25%","50%","75%","100%")) +
         scale_color_ipsum(name = "",breaks=c("Valor mínimo","Valor medio","Valor máximo")) +
         labs(
           x =NULL , y = "Fibrosis Pulmonar Progresiva por Etiología",
           title = ""
         ) +
         theme_ipsum_rc(grid = "X") +
         theme(
           plot.title=element_text(face="bold"),
           axis.title.x = element_text(face="bold"),
           axis.title.y = element_text(face="bold",size=13),
           panel.grid.major.y = element_blank(),
           legend.text = element_text(face="bold",size=13),
           legend.title = element_blank(),
           panel.border = element_blank(),
           legend.position = "top",
           axis.text.y = element_text(size = 13, face = "bold"),
           axis.text.x = element_text(size = 13, face = "bold"))
       

       sp+scale_color_manual(values = c("Valor mínimo" = "#ffff04", 
                             "Valor medio" = "#edea0f",                                 
                             "Valor máximo" = "#a0ce3a"))
percent_first <- function(x) {
  x <- sprintf("%0.1f%%", round(x, digits = 1))
  x
}


       sp<-ggplot() +
         geom_segment(
           data = gather(xdf, measure, val, -cat) %>% 
             group_by(cat) %>% 
             top_n(-1) %>% 
             slice(1) %>%
             ungroup(),
           aes(x = 0, xend = val, y = cat, yend = cat),
           linetype = "dotted", size = 0.5, color = "gray80"
         ) +
         geom_segment(
           data = gather(xdf, measure, val, -cat) %>% 
             group_by(cat) %>% 
             summarise(start = range(val)[1], end = range(val)[2]) %>% 
             ungroup(),
           aes(x = start, xend = end, y = cat, yend = cat),
           color = "gray80", size = 7.5
         ) +
         geom_text(color="black", size=6, vjust=2, hjust= 0.5,
        aes(x=xdf$`Valor máximo`, y=xdf$cat, label=percent_first(xdf$`Valor máximo`))) +
         geom_text(color="black", size=6, vjust=2, hjust= 0.5,
        aes(x=xdf$`Valor mínimo`, y=xdf$cat, label=percent_first(xdf$`Valor mínimo`))) +
         geom_text(color="black", size=6, vjust=2, hjust= 0.5,
        aes(x=xdf$`Valor medio`, y=xdf$cat, label=percent_first(xdf$`Valor medio`))) +
         geom_point(
           data = gather(xdf, measure, value, -cat),
           aes(value, cat, color = measure), 
           size = 10
         ) +
         scale_x_comma(position = "top", limits = c(-3, 100),labels = c("0%","25%","50%","75%","100%")) +
         scale_color_ipsum(name = "",breaks=c("Valor mínimo","Valor medio","Valor máximo")) +
         labs(
           x =NULL , y = "Fibrosis Pulmonar Progresiva por Etiología",
           title = ""
         ) +
         theme_ipsum_rc(grid = "X") +
         theme(
           plot.title=element_text(face="bold"),
           axis.title.x = element_text(face="bold"),
           axis.title.y = element_text(face="bold",size=13),
           panel.grid.major.y = element_blank(),
           legend.text = element_text(face="bold",size=13),
           legend.title = element_blank(),
           panel.border = element_blank(),
           legend.position = "top",
           axis.text.y = element_text(size = 13, face = "bold"),
           axis.text.x = element_text(size = 13, face = "bold"))
       

       sp+scale_color_manual(values = c("Valor mínimo" = "#ffff04", 
                             "Valor medio" = "#edea0f",                                 
                             "Valor máximo" = "#a0ce3a"))
título editado
Enlace
Adrián P.L.
  • 495
  • 1
  • 9
  • 33

Añadir color degradado a las barras geom_seg de un ggplotgráfico de lollipop con dos grupos

Origen Enlace
Adrián P.L.
  • 495
  • 1
  • 9
  • 33

Añadir color degradado a las barras geom_seg de un ggplot

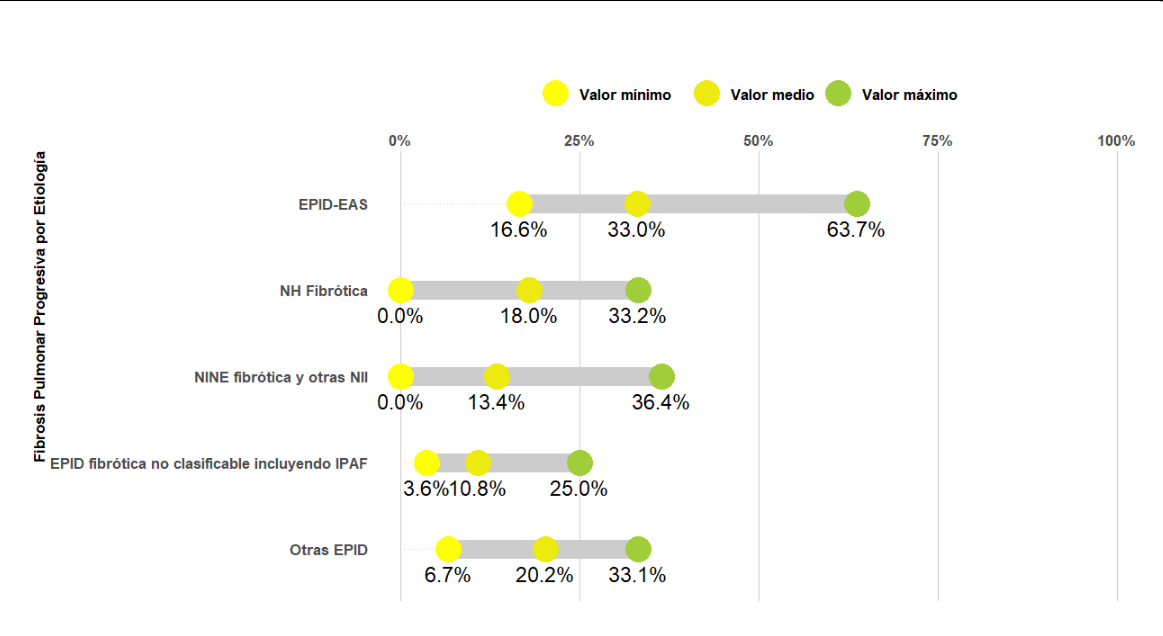
A partir de esta tabla:

      cat                                            Valor mínimo   Valor máximo    Valor medio
      EPID-EAS                                         16.6           63.7             33
      NH Fibrótica                                       0            33.2             18
      NINE fibrótica y otras NII                         0            36.4            13.4
      EPID fibrótica no clasificable incluyendo IPAF    3.6           25              10.8
      Otras EPID                                        6.7           33.1            20.2

he construído una gráfica que muestra como es la variación de los valores desde un valor mínimo a máximo pasando a un punto medio mediante el siguiente código:

percent_first <- function(x) { x <- sprintf("%0.1f%%", round(x, digits = 1)) x }

       sp<-ggplot() +
         geom_segment(
           data = gather(xdf, measure, val, -cat) %>% 
             group_by(cat) %>% 
             top_n(-1) %>% 
             slice(1) %>%
             ungroup(),
           aes(x = 0, xend = val, y = cat, yend = cat),
           linetype = "dotted", size = 0.5, color = "gray80"
         ) +
         geom_segment(
           data = gather(xdf, measure, val, -cat) %>% 
             group_by(cat) %>% 
             summarise(start = range(val)[1], end = range(val)[2]) %>% 
             ungroup(),
           aes(x = start, xend = end, y = cat, yend = cat),
           color = "gray80", size = 7.5
         ) +
         geom_text(color="black", size=6, vjust=2, hjust= 0.5,
        aes(x=xdf$`Valor máximo`, y=xdf$cat, label=percent_first(xdf$`Valor máximo`))) +
         geom_text(color="black", size=6, vjust=2, hjust= 0.5,
        aes(x=xdf$`Valor mínimo`, y=xdf$cat, label=percent_first(xdf$`Valor mínimo`))) +
         geom_text(color="black", size=6, vjust=2, hjust= 0.5,
        aes(x=xdf$`Valor medio`, y=xdf$cat, label=percent_first(xdf$`Valor medio`))) +
         geom_point(
           data = gather(xdf, measure, value, -cat),
           aes(value, cat, color = measure), 
           size = 10
         ) +
         scale_x_comma(position = "top", limits = c(-3, 100),labels = c("0%","25%","50%","75%","100%")) +
         scale_color_ipsum(name = "",breaks=c("Valor mínimo","Valor medio","Valor máximo")) +
         labs(
           x =NULL , y = "Fibrosis Pulmonar Progresiva por Etiología",
           title = ""
         ) +
         theme_ipsum_rc(grid = "X") +
         theme(
           plot.title=element_text(face="bold"),
           axis.title.x = element_text(face="bold"),
           axis.title.y = element_text(face="bold",size=13),
           panel.grid.major.y = element_blank(),
           legend.text = element_text(face="bold",size=13),
           legend.title = element_blank(),
           panel.border = element_blank(),
           legend.position = "top",
           axis.text.y = element_text(size = 13, face = "bold"),
           axis.text.x = element_text(size = 13, face = "bold"))
       

       sp+scale_color_manual(values = c("Valor mínimo" = "#ffff04", 
                             "Valor medio" = "#edea0f",                                 
                             "Valor máximo" = "#a0ce3a"))

Para obtener la siguiente gráfica:

introducir la descripción de la imagen aquí

Me gustaría que la barra que aparece en gris tenga un color degradado desde amarillo a verde (el color que aparece en los puntos. He intentado añadirlo con scale_colour_gradient() pero no logro incorporarlo y que no me de error.

¿Cómo podría añadir dicho degradado? Gracias de antemano.