Coreción gramatical.
Origen Enlace
FJSevilla
  • 62.1k
  • 7
  • 43
  • 68

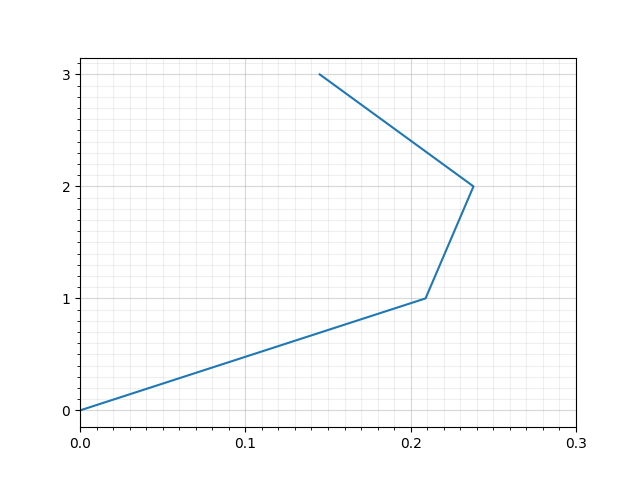
El problema es que le estás asignando las mismas marcas mayores a ambos ejes, por lo que los ticks en X van de 1 en 1 y deberían de ir de 0.1 en 0.1 Debes crear una maracasmarcas adecuadas a tu eje X:

import numpy as np
import matplotlib.pyplot as plt


drift = np.array([-0, 0.209, 0.238, 0.145])

# Elaborar gráfico --------------------------------------------------------

fig = plt.figure()
ax = fig.add_subplot(1, 1, 1)

# Líneas maestras cada 1m, líneas menores cada 0.25m.

x_max = np.ceil(np.max(drift) * 10) / 10
x_min = np.floor(np.min(drift) * 10) / 10

major_ticks_x = np.arange(x_min, x_max + 0.1, 0.1)
minor_ticks_x = np.arange(x_min, x_max + 0.1, 0.01)
major_ticks_y = np.arange(0, 10, 1)
minor_ticks_y = np.arange(0, 10, 0.1)

ax.set_xticks(major_ticks_x)
ax.set_xticks(minor_ticks_x, minor=True)
ax.set_yticks(major_ticks_y)
ax.set_yticks(minor_ticks_y, minor=True)

ax.set_xlim(xmax=x_max, xmin=np.min(drift))

# Añado el correspondiente grid
ax.grid(which='both')
# Configuro los grosores de línea de los grids:
ax.grid(which='minor', alpha=0.2)
ax.grid(which='major', alpha=0.5)

plt.plot(drift, np.arange(4))  
plt.show()
introducir la descripción de la imagen aquí

El problema es que le estás asignando las mismas marcas mayores a ambos ejes, por lo que los ticks en X van de 1 en 1 y deberían de ir de 0.1 en 0.1 Debes crear una maracas adecuadas a tu eje X:

import numpy as np
import matplotlib.pyplot as plt


drift = np.array([-0, 0.209, 0.238, 0.145])

# Elaborar gráfico --------------------------------------------------------

fig = plt.figure()
ax = fig.add_subplot(1, 1, 1)

# Líneas maestras cada 1m, líneas menores cada 0.25m.

x_max = np.ceil(np.max(drift) * 10) / 10
x_min = np.floor(np.min(drift) * 10) / 10

major_ticks_x = np.arange(x_min, x_max + 0.1, 0.1)
minor_ticks_x = np.arange(x_min, x_max + 0.1, 0.01)
major_ticks_y = np.arange(0, 10, 1)
minor_ticks_y = np.arange(0, 10, 0.1)

ax.set_xticks(major_ticks_x)
ax.set_xticks(minor_ticks_x, minor=True)
ax.set_yticks(major_ticks_y)
ax.set_yticks(minor_ticks_y, minor=True)

ax.set_xlim(xmax=x_max, xmin=np.min(drift))

# Añado el correspondiente grid
ax.grid(which='both')
# Configuro los grosores de línea de los grids:
ax.grid(which='minor', alpha=0.2)
ax.grid(which='major', alpha=0.5)

plt.plot(drift, np.arange(4))  
plt.show()

introducir la descripción de la imagen aquí

El problema es que le estás asignando las mismas marcas mayores a ambos ejes, por lo que los ticks en X van de 1 en 1 y deberían de ir de 0.1 en 0.1 Debes crear una marcas adecuadas a tu eje X:

import numpy as np
import matplotlib.pyplot as plt


drift = np.array([-0, 0.209, 0.238, 0.145])

# Elaborar gráfico --------------------------------------------------------

fig = plt.figure()
ax = fig.add_subplot(1, 1, 1)

# Líneas maestras cada 1m, líneas menores cada 0.25m.

x_max = np.ceil(np.max(drift) * 10) / 10
x_min = np.floor(np.min(drift) * 10) / 10

major_ticks_x = np.arange(x_min, x_max + 0.1, 0.1)
minor_ticks_x = np.arange(x_min, x_max + 0.1, 0.01)
major_ticks_y = np.arange(0, 10, 1)
minor_ticks_y = np.arange(0, 10, 0.1)

ax.set_xticks(major_ticks_x)
ax.set_xticks(minor_ticks_x, minor=True)
ax.set_yticks(major_ticks_y)
ax.set_yticks(minor_ticks_y, minor=True)

ax.set_xlim(xmax=x_max, xmin=np.min(drift))

# Añado el correspondiente grid
ax.grid(which='both')
# Configuro los grosores de línea de los grids:
ax.grid(which='minor', alpha=0.2)
ax.grid(which='major', alpha=0.5)

plt.plot(drift, np.arange(4))  
plt.show()

introducir la descripción de la imagen aquí

Origen Enlace
FJSevilla
  • 62.1k
  • 7
  • 43
  • 68

El problema es que le estás asignando las mismas marcas mayores a ambos ejes, por lo que los ticks en X van de 1 en 1 y deberían de ir de 0.1 en 0.1 Debes crear una maracas adecuadas a tu eje X:

import numpy as np
import matplotlib.pyplot as plt


drift = np.array([-0, 0.209, 0.238, 0.145])

# Elaborar gráfico --------------------------------------------------------

fig = plt.figure()
ax = fig.add_subplot(1, 1, 1)

# Líneas maestras cada 1m, líneas menores cada 0.25m.

x_max = np.ceil(np.max(drift) * 10) / 10
x_min = np.floor(np.min(drift) * 10) / 10

major_ticks_x = np.arange(x_min, x_max + 0.1, 0.1)
minor_ticks_x = np.arange(x_min, x_max + 0.1, 0.01)
major_ticks_y = np.arange(0, 10, 1)
minor_ticks_y = np.arange(0, 10, 0.1)

ax.set_xticks(major_ticks_x)
ax.set_xticks(minor_ticks_x, minor=True)
ax.set_yticks(major_ticks_y)
ax.set_yticks(minor_ticks_y, minor=True)

ax.set_xlim(xmax=x_max, xmin=np.min(drift))

# Añado el correspondiente grid
ax.grid(which='both')
# Configuro los grosores de línea de los grids:
ax.grid(which='minor', alpha=0.2)
ax.grid(which='major', alpha=0.5)

plt.plot(drift, np.arange(4))  
plt.show()

introducir la descripción de la imagen aquí