re-etiquetado al hablarse de gráficos en R hay que hacer una diferencia si es R base o a través de un paquete, también el OP esta teniendo dificultades en concepto de diseño, habla de eje X cuando en las coordenadas polares se trabaja con radios, la confusión proviene de que son histogramas ejes X-Y
Origen Enlace

Alinear labelsEtiquetas en Circular barplot

Tengo una cosultaconsulta, este es el código de ejemplo que viene elen la documentación de ggplotggplot en RR.

# library
library(tidyverse)

# Create dataset
data=data.frame(
  individual=paste( "Mister ", seq(1,60), sep=""),
  group=c( rep('A', 10), rep('B', 30), rep('C', 14), rep('D', 6)) ,
  value=sample( seq(10,100), 60, replace=T)
)

# Set a number of 'empty bar' to add at the end of each group
empty_bar=3
to_add = data.frame( matrix(NA, empty_bar*nlevels(data$group), ncol(data)) )
colnames(to_add) = colnames(data)
to_add$group=rep(levels(data$group), each=empty_bar)
data=rbind(data, to_add)
data=data %>% arrange(group)
data$id=seq(1, nrow(data))

# Get the name and the y position of each label
label_data=data
number_of_bar=nrow(label_data)
angle= 90 - 360 * (label_data$id-0.5) /number_of_bar     # I substract 0.5 because the letter must have the angle of the center of the bars. Not extreme right(1) or extreme left (0)
label_data$hjust<-ifelse( angle < -90, 1, 0)
#label_data$vjust = -10
label_data$angle<-ifelse(angle < -90, angle+180, angle)

# prepare a data frame for base lines
base_data=data %>% 
  group_by(group) %>% 
  summarize(start=min(id), end=max(id) - empty_bar) %>% 
  rowwise() %>% 
  mutate(title=mean(c(start, end)))

# prepare a data frame for grid (scales)
grid_data = base_data
grid_data$end = grid_data$end[ c( nrow(grid_data), 1:nrow(grid_data)-1)] + 1
grid_data$start = grid_data$start - 1
grid_data=grid_data[-1,]

# Make the plot
p = ggplot(data, aes(x=as.factor(id), y=value, fill=group)) +       # Note that id is a factor. If x is numeric, there is some space between the first bar
  
  geom_bar(aes(x=as.factor(id), y=value, fill=group), stat="identity", alpha=0.5) +
  
  # Add a val=100/75/50/25 lines. I do it at the beginning to make sur barplots are OVER it.
  geom_segment(data=grid_data, aes(x = end, y = 80, xend = start, yend = 80), colour = "grey", alpha=1, size=0.3 , inherit.aes = FALSE ) +
  geom_segment(data=grid_data, aes(x = end, y = 60, xend = start, yend = 60), colour = "grey", alpha=1, size=0.3 , inherit.aes = FALSE ) +
  geom_segment(data=grid_data, aes(x = end, y = 40, xend = start, yend = 40), colour = "grey", alpha=1, size=0.3 , inherit.aes = FALSE ) +
  geom_segment(data=grid_data, aes(x = end, y = 20, xend = start, yend = 20), colour = "grey", alpha=1, size=0.3 , inherit.aes = FALSE ) +
  
  # Add text showing the value of each 100/75/50/25 lines
  annotate("text", x = rep(max(data$id),4), y = c(20, 40, 60, 80), label = c("20", "40", "60", "80") , color="grey", size=3 , angle=0, fontface="bold", hjust=1) +
  
  geom_bar(aes(x=as.factor(id), y=value, fill=group), stat="identity", alpha=0.5) +
  ylim(-100,120) +
  theme_minimal() +
  theme(
    legend.position = "none",
    axis.text = element_blank(),
    axis.title = element_blank(),
    panel.grid = element_blank(),
    plot.margin = unit(rep(-1,4), "cm") 
  ) +
  coord_polar() + 
  geom_text(data=label_data, aes(x=id, y=value+10, label=individual, hjust=hjust), color="black", fontface="bold",alpha=0.6, size=2.5, angle= label_data$angle, inherit.aes = FALSE ) +
  
  # Add base line information
  geom_segment(data=base_data, aes(x = start, y = -5, xend = end, yend = -5), colour = "black", alpha=0.8, size=0.6 , inherit.aes = FALSE )  +
  geom_text(data=base_data, aes(x = title, y = -18, label=group), hjust=c(1,1,0,0), colour = "black", alpha=0.8, size=4, fontface="bold", inherit.aes = FALSE)

p # se imprime

p

Rplot nb

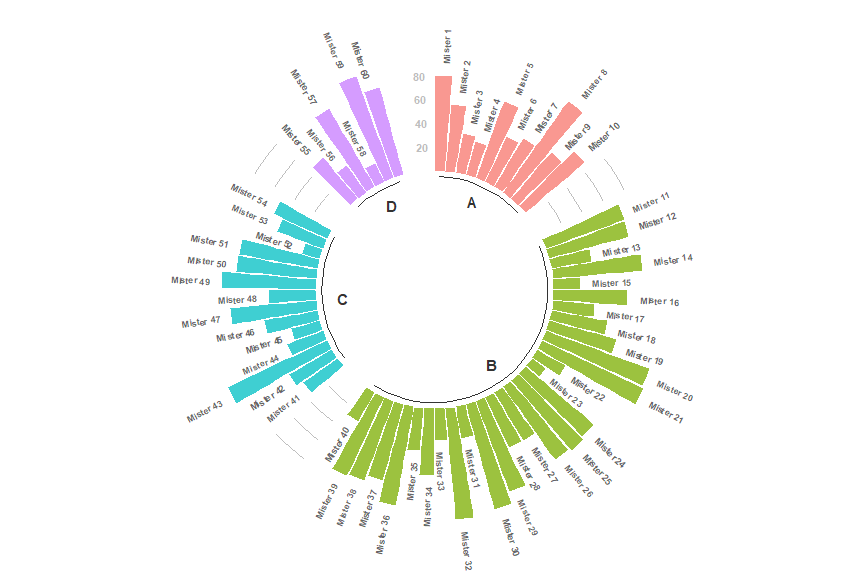
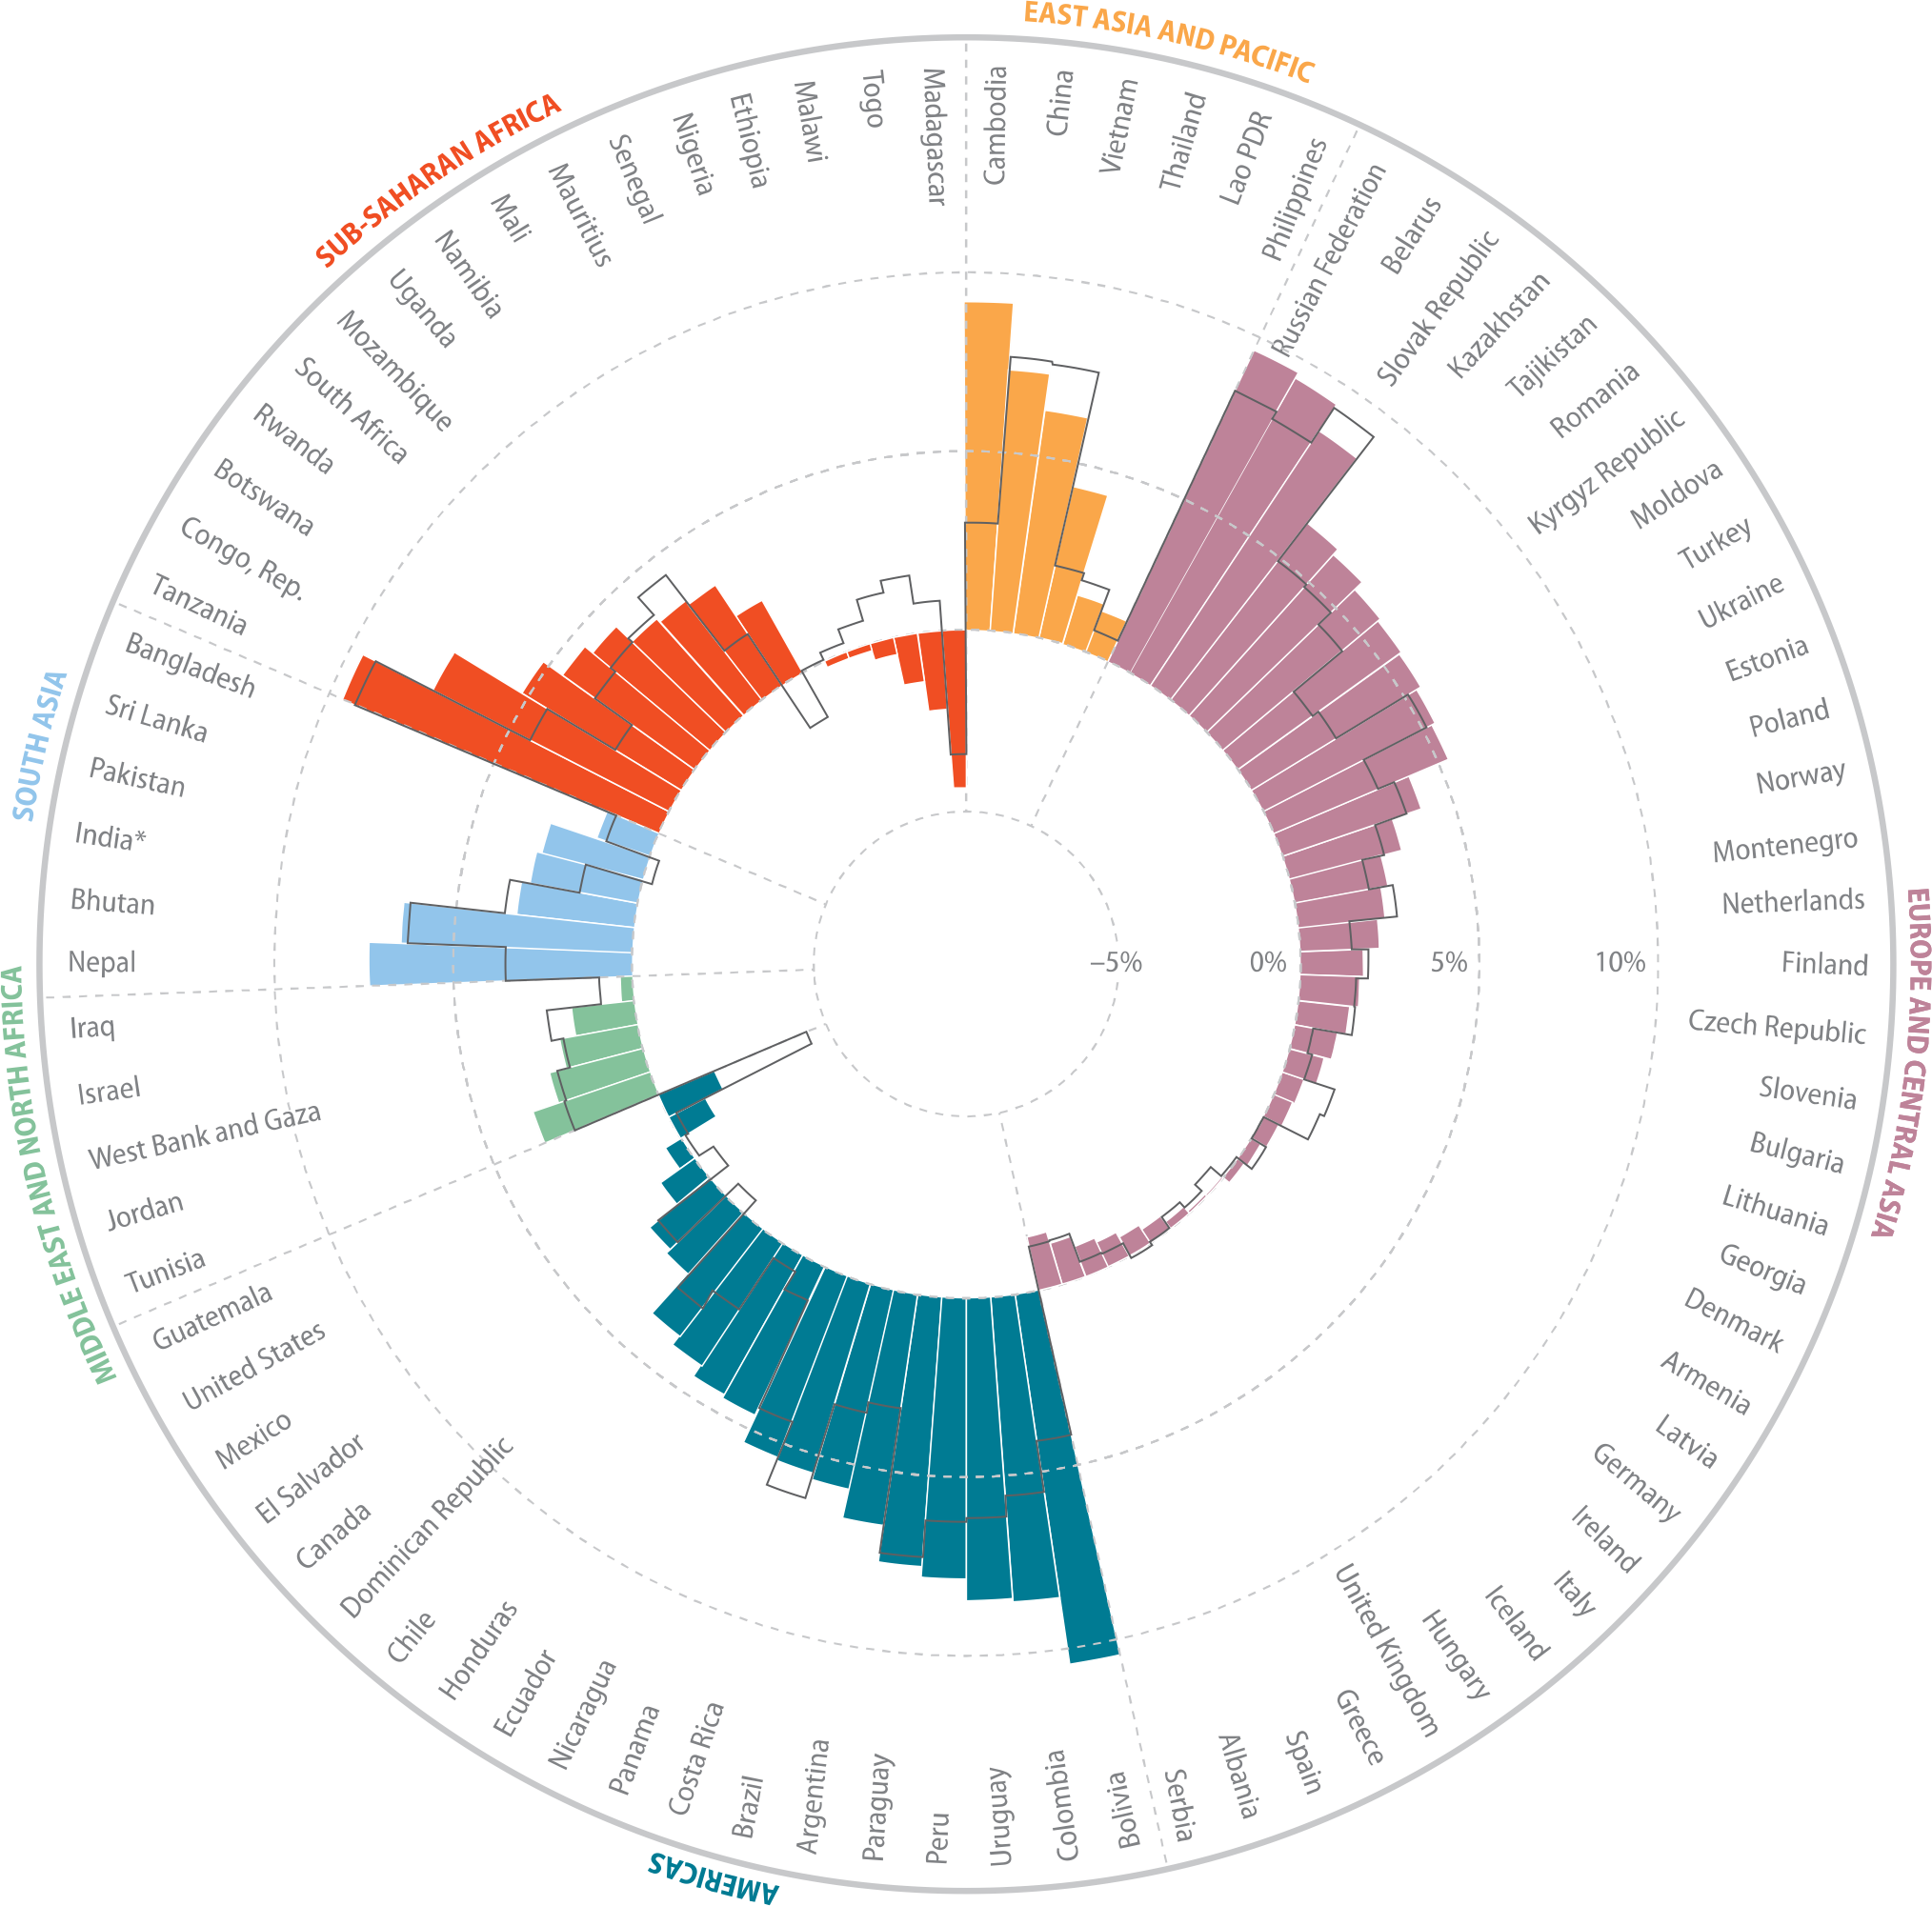
Quisiera que las etiquetas estén alineadas de esta forma.

Las etiquetas de las series están alineadas a una misma distancia desde el eje x pero no sé cómo hacerlo. Agradezco mucho que se tomen su tiempo para ayudarme.
Alinear labels en Circular barplot

Tengo una cosulta, este es el código de ejemplo que viene el la documentación de ggplot en R.

# library
library(tidyverse)

# Create dataset
data=data.frame(
  individual=paste( "Mister ", seq(1,60), sep=""),
  group=c( rep('A', 10), rep('B', 30), rep('C', 14), rep('D', 6)) ,
  value=sample( seq(10,100), 60, replace=T)
)

# Set a number of 'empty bar' to add at the end of each group
empty_bar=3
to_add = data.frame( matrix(NA, empty_bar*nlevels(data$group), ncol(data)) )
colnames(to_add) = colnames(data)
to_add$group=rep(levels(data$group), each=empty_bar)
data=rbind(data, to_add)
data=data %>% arrange(group)
data$id=seq(1, nrow(data))

# Get the name and the y position of each label
label_data=data
number_of_bar=nrow(label_data)
angle= 90 - 360 * (label_data$id-0.5) /number_of_bar     # I substract 0.5 because the letter must have the angle of the center of the bars. Not extreme right(1) or extreme left (0)
label_data$hjust<-ifelse( angle < -90, 1, 0)
#label_data$vjust = -10
label_data$angle<-ifelse(angle < -90, angle+180, angle)

# prepare a data frame for base lines
base_data=data %>% 
  group_by(group) %>% 
  summarize(start=min(id), end=max(id) - empty_bar) %>% 
  rowwise() %>% 
  mutate(title=mean(c(start, end)))

# prepare a data frame for grid (scales)
grid_data = base_data
grid_data$end = grid_data$end[ c( nrow(grid_data), 1:nrow(grid_data)-1)] + 1
grid_data$start = grid_data$start - 1
grid_data=grid_data[-1,]

# Make the plot
p = ggplot(data, aes(x=as.factor(id), y=value, fill=group)) +       # Note that id is a factor. If x is numeric, there is some space between the first bar
  
  geom_bar(aes(x=as.factor(id), y=value, fill=group), stat="identity", alpha=0.5) +
  
  # Add a val=100/75/50/25 lines. I do it at the beginning to make sur barplots are OVER it.
  geom_segment(data=grid_data, aes(x = end, y = 80, xend = start, yend = 80), colour = "grey", alpha=1, size=0.3 , inherit.aes = FALSE ) +
  geom_segment(data=grid_data, aes(x = end, y = 60, xend = start, yend = 60), colour = "grey", alpha=1, size=0.3 , inherit.aes = FALSE ) +
  geom_segment(data=grid_data, aes(x = end, y = 40, xend = start, yend = 40), colour = "grey", alpha=1, size=0.3 , inherit.aes = FALSE ) +
  geom_segment(data=grid_data, aes(x = end, y = 20, xend = start, yend = 20), colour = "grey", alpha=1, size=0.3 , inherit.aes = FALSE ) +
  
  # Add text showing the value of each 100/75/50/25 lines
  annotate("text", x = rep(max(data$id),4), y = c(20, 40, 60, 80), label = c("20", "40", "60", "80") , color="grey", size=3 , angle=0, fontface="bold", hjust=1) +
  
  geom_bar(aes(x=as.factor(id), y=value, fill=group), stat="identity", alpha=0.5) +
  ylim(-100,120) +
  theme_minimal() +
  theme(
    legend.position = "none",
    axis.text = element_blank(),
    axis.title = element_blank(),
    panel.grid = element_blank(),
    plot.margin = unit(rep(-1,4), "cm") 
  ) +
  coord_polar() + 
  geom_text(data=label_data, aes(x=id, y=value+10, label=individual, hjust=hjust), color="black", fontface="bold",alpha=0.6, size=2.5, angle= label_data$angle, inherit.aes = FALSE ) +
  
  # Add base line information
  geom_segment(data=base_data, aes(x = start, y = -5, xend = end, yend = -5), colour = "black", alpha=0.8, size=0.6 , inherit.aes = FALSE )  +
  geom_text(data=base_data, aes(x = title, y = -18, label=group), hjust=c(1,1,0,0), colour = "black", alpha=0.8, size=4, fontface="bold", inherit.aes = FALSE)

p

Rplot nb

Quisiera que las etiquetas estén alineadas de esta forma

Las etiquetas de las series están alineadas a una misma distancia desde el eje x pero no sé cómo hacerlo. Agradezco mucho que se tomen su tiempo para ayudarme.

Alinear Etiquetas en Circular barplot

Tengo una consulta, este es el código de ejemplo que viene en la documentación de ggplot en R.

# library
library(tidyverse)

# Create dataset
data=data.frame(
  individual=paste( "Mister ", seq(1,60), sep=""),
  group=c( rep('A', 10), rep('B', 30), rep('C', 14), rep('D', 6)) ,
  value=sample( seq(10,100), 60, replace=T)
)

# Set a number of 'empty bar' to add at the end of each group
empty_bar=3
to_add = data.frame( matrix(NA, empty_bar*nlevels(data$group), ncol(data)) )
colnames(to_add) = colnames(data)
to_add$group=rep(levels(data$group), each=empty_bar)
data=rbind(data, to_add)
data=data %>% arrange(group)
data$id=seq(1, nrow(data))

# Get the name and the y position of each label
label_data=data
number_of_bar=nrow(label_data)
angle= 90 - 360 * (label_data$id-0.5) /number_of_bar     # I substract 0.5 because the letter must have the angle of the center of the bars. Not extreme right(1) or extreme left (0)
label_data$hjust<-ifelse( angle < -90, 1, 0)
#label_data$vjust = -10
label_data$angle<-ifelse(angle < -90, angle+180, angle)

# prepare a data frame for base lines
base_data=data %>% 
  group_by(group) %>% 
  summarize(start=min(id), end=max(id) - empty_bar) %>% 
  rowwise() %>% 
  mutate(title=mean(c(start, end)))

# prepare a data frame for grid (scales)
grid_data = base_data
grid_data$end = grid_data$end[ c( nrow(grid_data), 1:nrow(grid_data)-1)] + 1
grid_data$start = grid_data$start - 1
grid_data=grid_data[-1,]

# Make the plot
p = ggplot(data, aes(x=as.factor(id), y=value, fill=group)) +       # Note that id is a factor. If x is numeric, there is some space between the first bar
  
  geom_bar(aes(x=as.factor(id), y=value, fill=group), stat="identity", alpha=0.5) +
  
  # Add a val=100/75/50/25 lines. I do it at the beginning to make sur barplots are OVER it.
  geom_segment(data=grid_data, aes(x = end, y = 80, xend = start, yend = 80), colour = "grey", alpha=1, size=0.3 , inherit.aes = FALSE ) +
  geom_segment(data=grid_data, aes(x = end, y = 60, xend = start, yend = 60), colour = "grey", alpha=1, size=0.3 , inherit.aes = FALSE ) +
  geom_segment(data=grid_data, aes(x = end, y = 40, xend = start, yend = 40), colour = "grey", alpha=1, size=0.3 , inherit.aes = FALSE ) +
  geom_segment(data=grid_data, aes(x = end, y = 20, xend = start, yend = 20), colour = "grey", alpha=1, size=0.3 , inherit.aes = FALSE ) +
  
  # Add text showing the value of each 100/75/50/25 lines
  annotate("text", x = rep(max(data$id),4), y = c(20, 40, 60, 80), label = c("20", "40", "60", "80") , color="grey", size=3 , angle=0, fontface="bold", hjust=1) +
  
  geom_bar(aes(x=as.factor(id), y=value, fill=group), stat="identity", alpha=0.5) +
  ylim(-100,120) +
  theme_minimal() +
  theme(
    legend.position = "none",
    axis.text = element_blank(),
    axis.title = element_blank(),
    panel.grid = element_blank(),
    plot.margin = unit(rep(-1,4), "cm") 
  ) +
  coord_polar() + 
  geom_text(data=label_data, aes(x=id, y=value+10, label=individual, hjust=hjust), color="black", fontface="bold",alpha=0.6, size=2.5, angle= label_data$angle, inherit.aes = FALSE ) +
  
  # Add base line information
  geom_segment(data=base_data, aes(x = start, y = -5, xend = end, yend = -5), colour = "black", alpha=0.8, size=0.6 , inherit.aes = FALSE )  +
  geom_text(data=base_data, aes(x = title, y = -18, label=group), hjust=c(1,1,0,0), colour = "black", alpha=0.8, size=4, fontface="bold", inherit.aes = FALSE)

p # se imprime

Rplot

Quisiera que las etiquetas estén alineadas de esta forma.

Las etiquetas de las series están alineadas a una misma distancia desde el eje x pero no sé cómo hacerlo.

Origen Enlace

Alinear labels en Circular barplot

Tengo una cosulta, este es el código de ejemplo que viene el la documentación de ggplot en R.

# library
library(tidyverse)

# Create dataset
data=data.frame(
  individual=paste( "Mister ", seq(1,60), sep=""),
  group=c( rep('A', 10), rep('B', 30), rep('C', 14), rep('D', 6)) ,
  value=sample( seq(10,100), 60, replace=T)
)

# Set a number of 'empty bar' to add at the end of each group
empty_bar=3
to_add = data.frame( matrix(NA, empty_bar*nlevels(data$group), ncol(data)) )
colnames(to_add) = colnames(data)
to_add$group=rep(levels(data$group), each=empty_bar)
data=rbind(data, to_add)
data=data %>% arrange(group)
data$id=seq(1, nrow(data))

# Get the name and the y position of each label
label_data=data
number_of_bar=nrow(label_data)
angle= 90 - 360 * (label_data$id-0.5) /number_of_bar     # I substract 0.5 because the letter must have the angle of the center of the bars. Not extreme right(1) or extreme left (0)
label_data$hjust<-ifelse( angle < -90, 1, 0)
#label_data$vjust = -10
label_data$angle<-ifelse(angle < -90, angle+180, angle)

# prepare a data frame for base lines
base_data=data %>% 
  group_by(group) %>% 
  summarize(start=min(id), end=max(id) - empty_bar) %>% 
  rowwise() %>% 
  mutate(title=mean(c(start, end)))

# prepare a data frame for grid (scales)
grid_data = base_data
grid_data$end = grid_data$end[ c( nrow(grid_data), 1:nrow(grid_data)-1)] + 1
grid_data$start = grid_data$start - 1
grid_data=grid_data[-1,]

# Make the plot
p = ggplot(data, aes(x=as.factor(id), y=value, fill=group)) +       # Note that id is a factor. If x is numeric, there is some space between the first bar
  
  geom_bar(aes(x=as.factor(id), y=value, fill=group), stat="identity", alpha=0.5) +
  
  # Add a val=100/75/50/25 lines. I do it at the beginning to make sur barplots are OVER it.
  geom_segment(data=grid_data, aes(x = end, y = 80, xend = start, yend = 80), colour = "grey", alpha=1, size=0.3 , inherit.aes = FALSE ) +
  geom_segment(data=grid_data, aes(x = end, y = 60, xend = start, yend = 60), colour = "grey", alpha=1, size=0.3 , inherit.aes = FALSE ) +
  geom_segment(data=grid_data, aes(x = end, y = 40, xend = start, yend = 40), colour = "grey", alpha=1, size=0.3 , inherit.aes = FALSE ) +
  geom_segment(data=grid_data, aes(x = end, y = 20, xend = start, yend = 20), colour = "grey", alpha=1, size=0.3 , inherit.aes = FALSE ) +
  
  # Add text showing the value of each 100/75/50/25 lines
  annotate("text", x = rep(max(data$id),4), y = c(20, 40, 60, 80), label = c("20", "40", "60", "80") , color="grey", size=3 , angle=0, fontface="bold", hjust=1) +
  
  geom_bar(aes(x=as.factor(id), y=value, fill=group), stat="identity", alpha=0.5) +
  ylim(-100,120) +
  theme_minimal() +
  theme(
    legend.position = "none",
    axis.text = element_blank(),
    axis.title = element_blank(),
    panel.grid = element_blank(),
    plot.margin = unit(rep(-1,4), "cm") 
  ) +
  coord_polar() + 
  geom_text(data=label_data, aes(x=id, y=value+10, label=individual, hjust=hjust), color="black", fontface="bold",alpha=0.6, size=2.5, angle= label_data$angle, inherit.aes = FALSE ) +
  
  # Add base line information
  geom_segment(data=base_data, aes(x = start, y = -5, xend = end, yend = -5), colour = "black", alpha=0.8, size=0.6 , inherit.aes = FALSE )  +
  geom_text(data=base_data, aes(x = title, y = -18, label=group), hjust=c(1,1,0,0), colour = "black", alpha=0.8, size=4, fontface="bold", inherit.aes = FALSE)

p

Y este es el resultado

Rplot nb

Quisiera que las etiquetas estén alineadas de esta forma

s

Las etiquetas de las series están alineadas a una misma distancia desde el eje x pero no sé cómo hacerlo. Agradezco mucho que se tomen su tiempo para ayudarme.