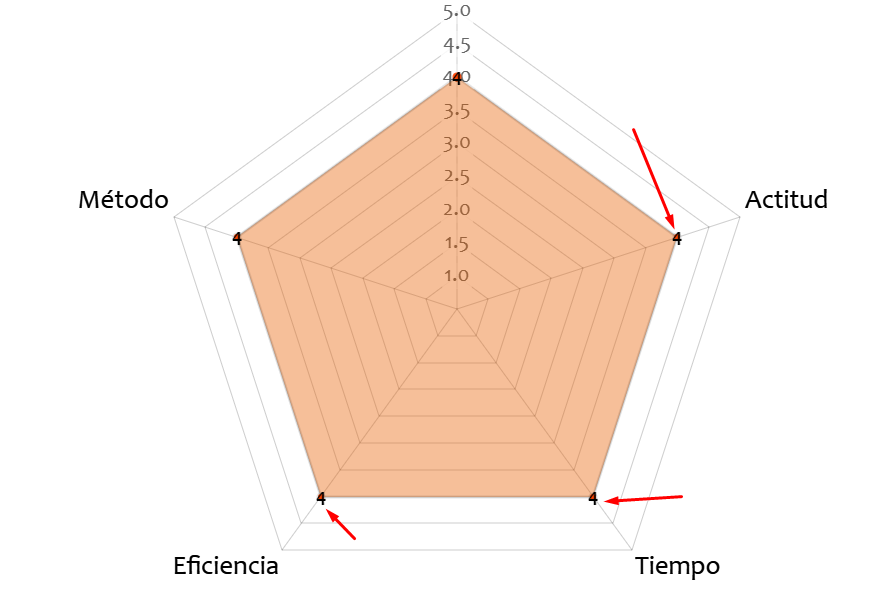
var Etiqueta4 = <%= Etiquetas4 %>;
                    var Valor4 = <%= valores4 %>;
                    var ctx2 = document.getElementById("Graf0").getContext('2d');
                    Chart.defaults.global.defaultFontFamily  = "candara"
                    Chart.defaults.global.defaultFontSize  = 0
                    var Graf0 = new Chart(ctx2, {
                        type: 'radar',
                        responsive: true,
                        scaleSteps: 4,
                        scaleStepWidth: 5,
                        scaleStartValue: 1,
                        data: {
                            labels: Etiqueta4,
                            datasets: [{
                                backgroundColor: ['rgba(232,95,0,0.4)'],
                                scaleSteps: 5,
                                fill: true,
                                min: 1,
                                max: 5,
                                scaleStartValue: 1,
                                pointRadius: 3,
                                pointBorderWidth: 3,
                                pointHoverRadius: 5,
                                pointBackgroundColor: "#FF4400",
                                pointBorderColor: ['rgba(255,68,0,0.9)'],
                                data: Valor4,},
                            ]
                        },

                        options: {
                            plugins: {
                                datalabels:{
                                    color: '#000',

                                    font: {
                                        size: 20,
                                        weight: 'bold'
                                    }
                                }
                            },

                            legend: {
                                display: false
                            },

                            scale: {
                                ticks: {
                                    beginAtZero: true,
                                    min: 0.5,
                                    max: 5,
                                    stepSize: 0.5,
                                    fontSize: 22

                                },

                                pointLabels: {
                                    fontSize: 27,
                                    fontColor: '#000'
                                },
                            },
                            title: {
                                display: true,
                                text: 'ENCUESTA - EVALUACIÓN DE DESEMPEÑO',
                                fontSize: 30,
                                fontFamily: "candara",
                                fontColor: '#000'
                            },
                        }
                    });
<div class="grafico_radar">
                    <canvas id="Graf0" class="radar"></canvas>
                </div>
