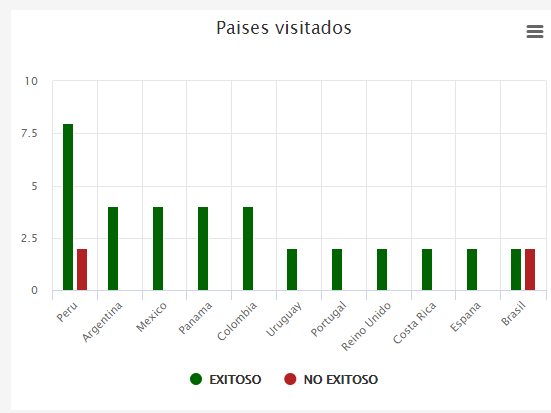
Necesito colocar estos resultados en una sola barra que la roja este junto a la verde adjunto la imagen estoy utilizando la librería de highcharts
Estoy utilizando el siguiente código:
chartCPU = new Highcharts.chart('graf',
                {
                    chart: {
                        type: 'column'
                    },
                    title: {
                        text: 'Paises visitados'
                    },
                    subtitle: {
                        text: ''
                    },
                    xAxis: {
                        gridLineWidth: 1,
                        categories:
                        [
                            <?php
                                foreach($param['PAIS'] as $PAIS)
                                {
                                    echo "'$PAIS',";
                                }
                            ?>
                        ]
                    },
                    yAxis:
                    [
                        {
                            min: 0,
                            title:
                            {
                                text: '',
                            }
                        }
                    ],
                    plotOptions: {
                        column: {
                            pointPadding: 0.1,
                            borderWidth: 1
                        }
                    },
                    credits: {
                      enabled: false
                    },
                    tooltip: {
                        split: true
                    },
                    series:
                    [
                        {
                            name: 'EXITOSO',
                            data:
                            [
                                <?php
                                    for ($j=0; $j < count($param['TOTAL_EXITOSO']) ; $j++)
                                    {
                                        echo $param['TOTAL_EXITOSO'][$j].',';
                                    }
                                ?>
                            ],
                            color: '#006400',
                            cursor: 'pointer'
                        },
                        {
                            name: 'NO EXITOSO',
                            data:
                            [
                                <?php
                                    for ($l=0; $l < count($param['TOTAL_NOEXITOSO']) ; $l++)
                                    {
                                        echo $param['TOTAL_NOEXITOSO'][$l].',';
                                    }
                                ?>
                            ],
                            color: '#B22222',
                            cursor: 'pointer'
                        }
                    ]
                });
