traducir título
Enlace
Alvaro Montoro
  • 49.8k
  • 28
  • 109
  • 190

Add contour lines to Añadir lineas de contorno a un plot filled.contour plot

Publicación reabierta por Alvaro Montoro
se añadieron 89 caracteres en el cuerpo
Origen Enlace

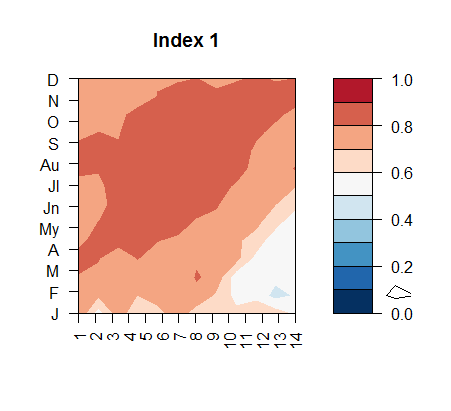
I am trying to create aestoy intentando realizar un contour plot withcon la función filled.contour but I would like to add contour lines to remark the significant values (I am plotting correlation values)y me gustaría añadir líneas de contorno para remarcar los valores significativos ya que estoy representando valores de correlación.

HereAquí is the input file calledestá el fichero de entrada llamado ts_months_max

This is the code I am usingEste es el código que estoy utilizando:

# ThisEsta functionfunción ismatrix.axes fromla encontré en el siguiente enlace: https://warwick.ac.uk/fac/sci/moac/people/students/peter_cock/r/matrix_contour/
matrix.axes <- function(data) {
  x <- (1:dim(data)[1] - 1) / (dim(data)[1] - 1);
  axis(side=2, at=x, labels=rownames(data), las=2);
  x <- (1:dim(data)[2] - 1) / (dim(data)[2] - 1);
  axis(side=1, at=x, labels=colnames(data), las=1);
}


library(colorRamps)
library(gplots)
library(graphics)
library(RColorBrewer)

ts_months_max <- as.matrix(read.csv('./example.csv',sep='')
    col <- rev(brewer.pal(n = 11, name = "RdBu"))
           filled.contour(ts_months_max,plot.axes=matrix.axes(ts_months_max), main="Index 1",levels=seq(0,1,0.1),col = col)

introducir la descripción de la imagen aquí

When I call the last line to contour the valuesCuando ejecuto la siguiente y última línea para contornear los valores > 0.5, only one contour is displayed and in the legendsólo un contorno se genera y se desplaza hacia la zona de la legenda.

 contour(ts_months_max, level=0.5,add=T)

introducir la descripción de la imagen aquí

May someone help me to solve this problem please?

Your suggestions would be greatly appreciatedAgradecería cualquier ayuda al respecto.

Thank youMuchas gracias.
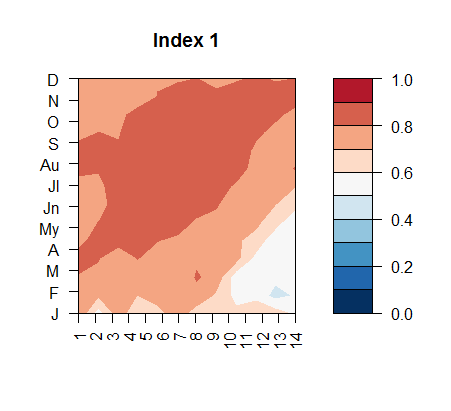
I am trying to create a contour plot with filled.contour but I would like to add contour lines to remark the significant values (I am plotting correlation values)

Here is the input file called ts_months_max

This is the code I am using:

# This function is from: https://warwick.ac.uk/fac/sci/moac/people/students/peter_cock/r/matrix_contour/
matrix.axes <- function(data) {
  x <- (1:dim(data)[1] - 1) / (dim(data)[1] - 1);
  axis(side=2, at=x, labels=rownames(data), las=2);
  x <- (1:dim(data)[2] - 1) / (dim(data)[2] - 1);
  axis(side=1, at=x, labels=colnames(data), las=1);
}


library(colorRamps)
library(gplots)
library(graphics)
library(RColorBrewer)

ts_months_max <- as.matrix(read.csv('./example.csv',sep='')
    col <- rev(brewer.pal(n = 11, name = "RdBu"))
           filled.contour(ts_months_max,plot.axes=matrix.axes(ts_months_max), main="Index 1",levels=seq(0,1,0.1),col = col)

introducir la descripción de la imagen aquí

When I call the last line to contour the values > 0.5, only one contour is displayed and in the legend.

 contour(ts_months_max, level=0.5,add=T)

introducir la descripción de la imagen aquí

May someone help me to solve this problem please?

Your suggestions would be greatly appreciated.

Thank you.

estoy intentando realizar un contour plot con la función filled.contour y me gustaría añadir líneas de contorno para remarcar los valores significativos ya que estoy representando valores de correlación.

Aquí está el fichero de entrada llamado ts_months_max

Este es el código que estoy utilizando:

# Esta función matrix.axes la encontré en el siguiente enlace: https://warwick.ac.uk/fac/sci/moac/people/students/peter_cock/r/matrix_contour/
matrix.axes <- function(data) {
  x <- (1:dim(data)[1] - 1) / (dim(data)[1] - 1);
  axis(side=2, at=x, labels=rownames(data), las=2);
  x <- (1:dim(data)[2] - 1) / (dim(data)[2] - 1);
  axis(side=1, at=x, labels=colnames(data), las=1);
}


library(colorRamps)
library(gplots)
library(graphics)
library(RColorBrewer)

ts_months_max <- as.matrix(read.csv('./example.csv',sep='')
    col <- rev(brewer.pal(n = 11, name = "RdBu"))
           filled.contour(ts_months_max,plot.axes=matrix.axes(ts_months_max), main="Index 1",levels=seq(0,1,0.1),col = col)

introducir la descripción de la imagen aquí

Cuando ejecuto la siguiente y última línea para contornear los valores > 0.5, sólo un contorno se genera y se desplaza hacia la zona de la legenda.

 contour(ts_months_max, level=0.5,add=T)

introducir la descripción de la imagen aquí

Agradecería cualquier ayuda al respecto.

Muchas gracias.

Publicación cerrada como "No adecuado para este sitio" por lois6b
Origen Enlace

Add contour lines to filled.contour plot

I am trying to create a contour plot with filled.contour but I would like to add contour lines to remark the significant values (I am plotting correlation values)

Here is the input file called ts_months_max

This is the code I am using:

# This function is from: https://warwick.ac.uk/fac/sci/moac/people/students/peter_cock/r/matrix_contour/
matrix.axes <- function(data) {
  x <- (1:dim(data)[1] - 1) / (dim(data)[1] - 1);
  axis(side=2, at=x, labels=rownames(data), las=2);
  x <- (1:dim(data)[2] - 1) / (dim(data)[2] - 1);
  axis(side=1, at=x, labels=colnames(data), las=1);
}


library(colorRamps)
library(gplots)
library(graphics)
library(RColorBrewer)

ts_months_max <- as.matrix(read.csv('./example.csv',sep='')
    col <- rev(brewer.pal(n = 11, name = "RdBu"))
           filled.contour(ts_months_max,plot.axes=matrix.axes(ts_months_max), main="Index 1",levels=seq(0,1,0.1),col = col)

introducir la descripción de la imagen aquí

When I call the last line to contour the values > 0.5, only one contour is displayed and in the legend.

 contour(ts_months_max, level=0.5,add=T)

introducir la descripción de la imagen aquí

May someone help me to solve this problem please?

Your suggestions would be greatly appreciated.

Thank you.